|
I use a lot of disks in my fileserver(s). I try to buy different models and versions in an attempt to de-correlate failures. I’ve bought a few external drives and shucked them in order to capitalize on deals that unfortunately only seem to apply to external drives.
One of the external drives I bought contained a Seagate Barracuda Compute drive. Searching around for information on this drive yields a large discussion about a drive technology called Shingled Magnetic Recording (or SMR):
Conventional hard disk drives record data by writing non-overlapping magnetic tracks parallel to each other (perpendicular recording), while shingled recording writes new tracks that overlap part of the previously written magnetic track, leaving the previous track narrower and allowing for higher track density. Thus, the tracks partially overlap similar to roof shingles.
SMR drives have drawbacks: if you want to rewrite a track, you have to rewrite affected tracks that overlap. Conventional Magnetic Recording (or CMR) does not have overlapping tracks and as a result has much more deterministic performance.
With the recent reveal that Western Digital was shipping SMR drives in models that were previously CMR (without notifying consumers!), I was concerned about the drives in my fileserver. Are they SMR? How could I detect this?
My concern comes from reports that ZFS resilvering a vdev that contains a SMR drive can sometimes cause the drive to report errors:
for most people “when you’re you’re resilvering is the first time you’ll notice something break.”
Not good.
There’s even reports of SMR drives not advertising themselves as such when queried for their SMART information. A smartmontools ticket titled Beware of SMR drives in CMR clothing talks about this:
There are a lot of SMR drives quietly submarining into supply channels that are programmed to “look” like “conventional” drives (CMR). This appears to be an attempt to end-run around consumer resistance.
WD and Seagate are both shipping drive-managed SMR (DM-SMR) drives which don’t report themselves as SMR when questioned via conventional means.
What’s worse, they’re shipping DM-SMR drives as “RAID” and “NAS” drives.
I have three models of HDD, all 8TB:
That ticket lists ways of using hdparm or smartctl to query if a drive is using SMR or not, but I wanted a definitive method, especially if the drive under test is not reporting itself properly.
I know the ST8000DM004 are SMR drives and am fairly confident that the other drives use conventional recording methods. This allows me to verify any benchmarking performed as well as any of the query tests posted in that ticket.
Querying those drives and looking at the “Streaming feature set supported” correctly maps to if the drive is known to be an SMR drive:
Device Model:     HGST HDN728080ALE604
  84      4          1   Streaming feature set supported <- not smr

Device Model:     ST8000DM004-2CX188
  84      4          0   Streaming feature set supported <- smr

Device Model:     WDC WD80EMAZ-00WJTA0
  84      4          1   Streaming feature set supported <- not smr
But I wanted something more definitive.
There is the question of trying to detect SMR drives using some sort of benchmarking software. The article mentioned here uses fio:
The fio workload used for this purpose was adapted for running on the external hard drives. This 128K sequential write workload was set to span the entire capacity of the drive.
fio is perfect for this - it will benchmark IO and keep detailed statistics that can then be analyzed and graphed. That’s the intention here :)
| Model | RPM | Cache | Block size |
| HDN728080ALE604 | 5425 | 128MB | 512 bytes logical, 4096 bytes physical |
| ST8000DM004-2CX188 | 7200 | 256MB | 512 bytes logical, 4096 bytes physical |
| WD80EMAZ-00WJTA0 | 5400 | 256MB | 512 bytes logical, 4096 bytes physical |
The following fio job description was used for each drive (shown here is the description for the ST8000DM004):
[global]
rw=randwrite
bs=128k
size=50g
ioengine=libaio
iodepth=32
direct=1
write_bw_log
write_lat_log

[ST8000DM004]
filename=/dev/disk/by-id/ata-ST8000DM004-2CX188_...
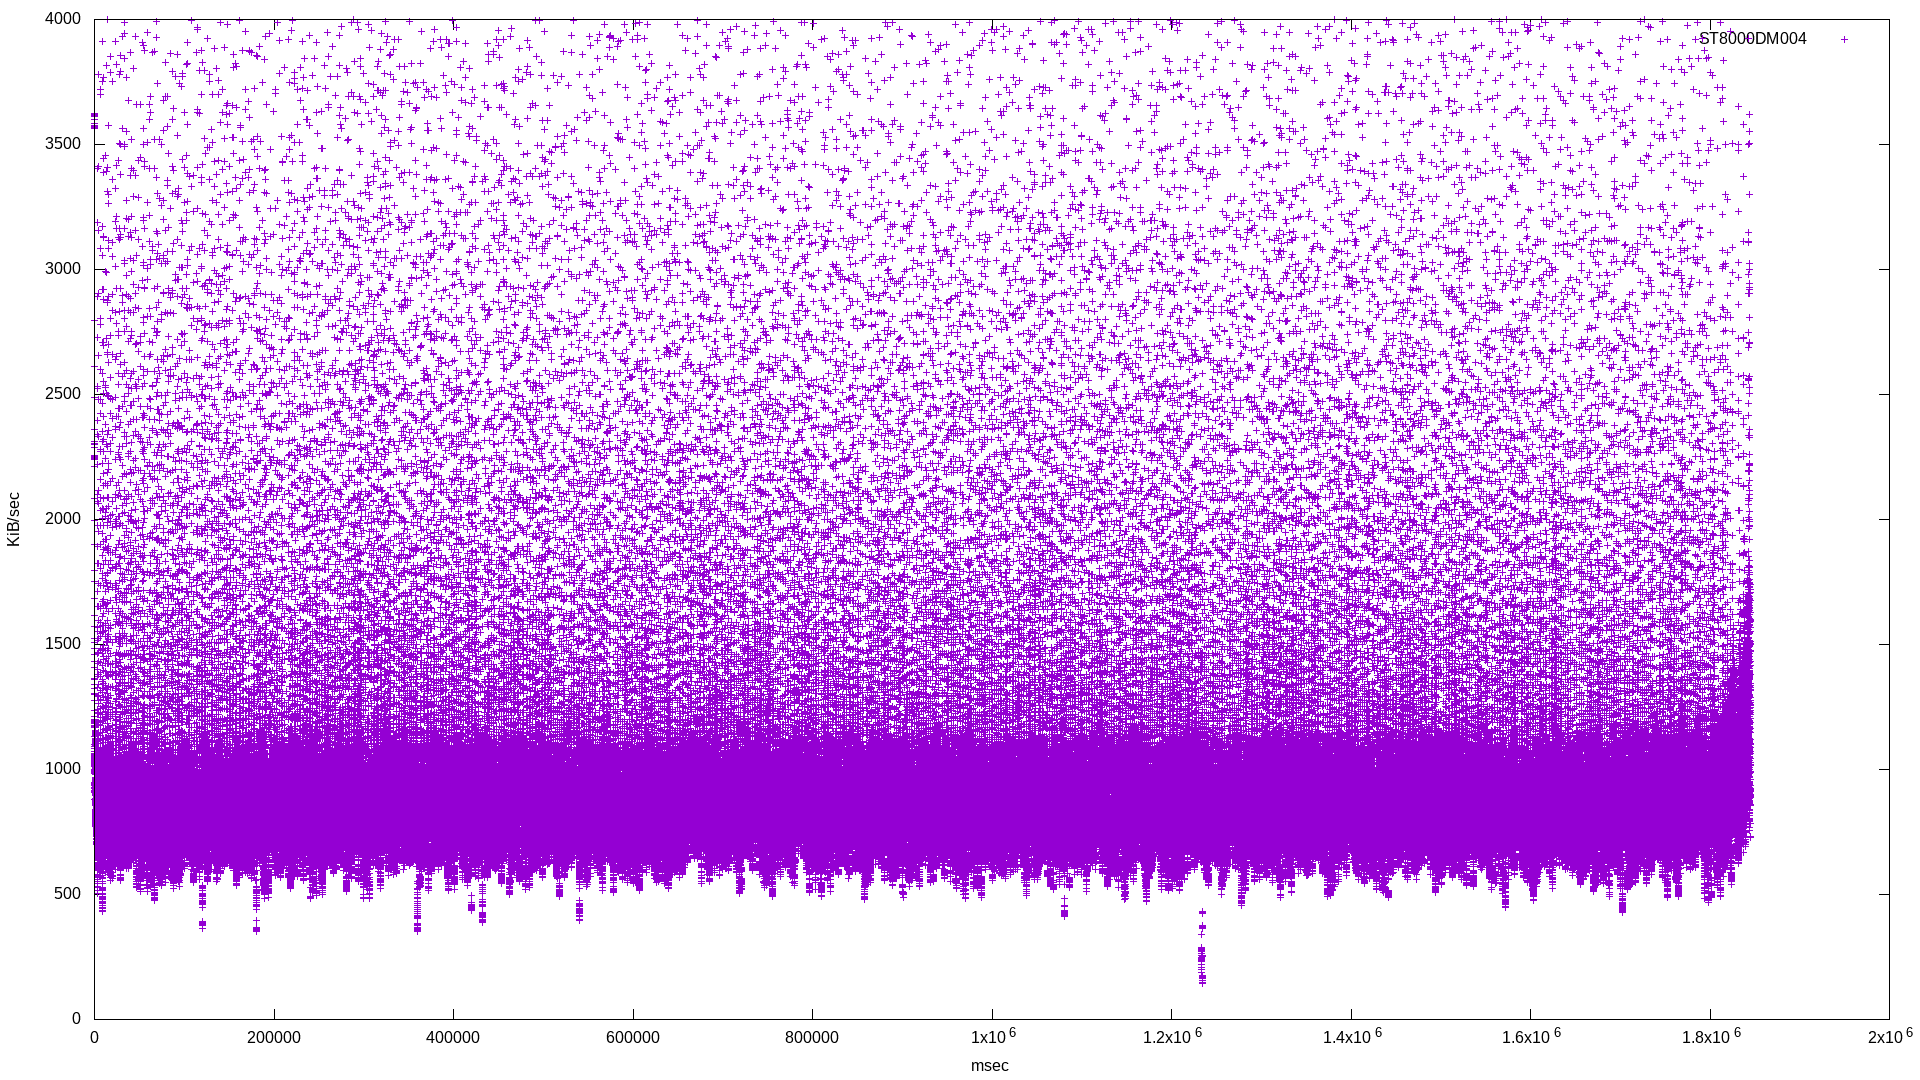
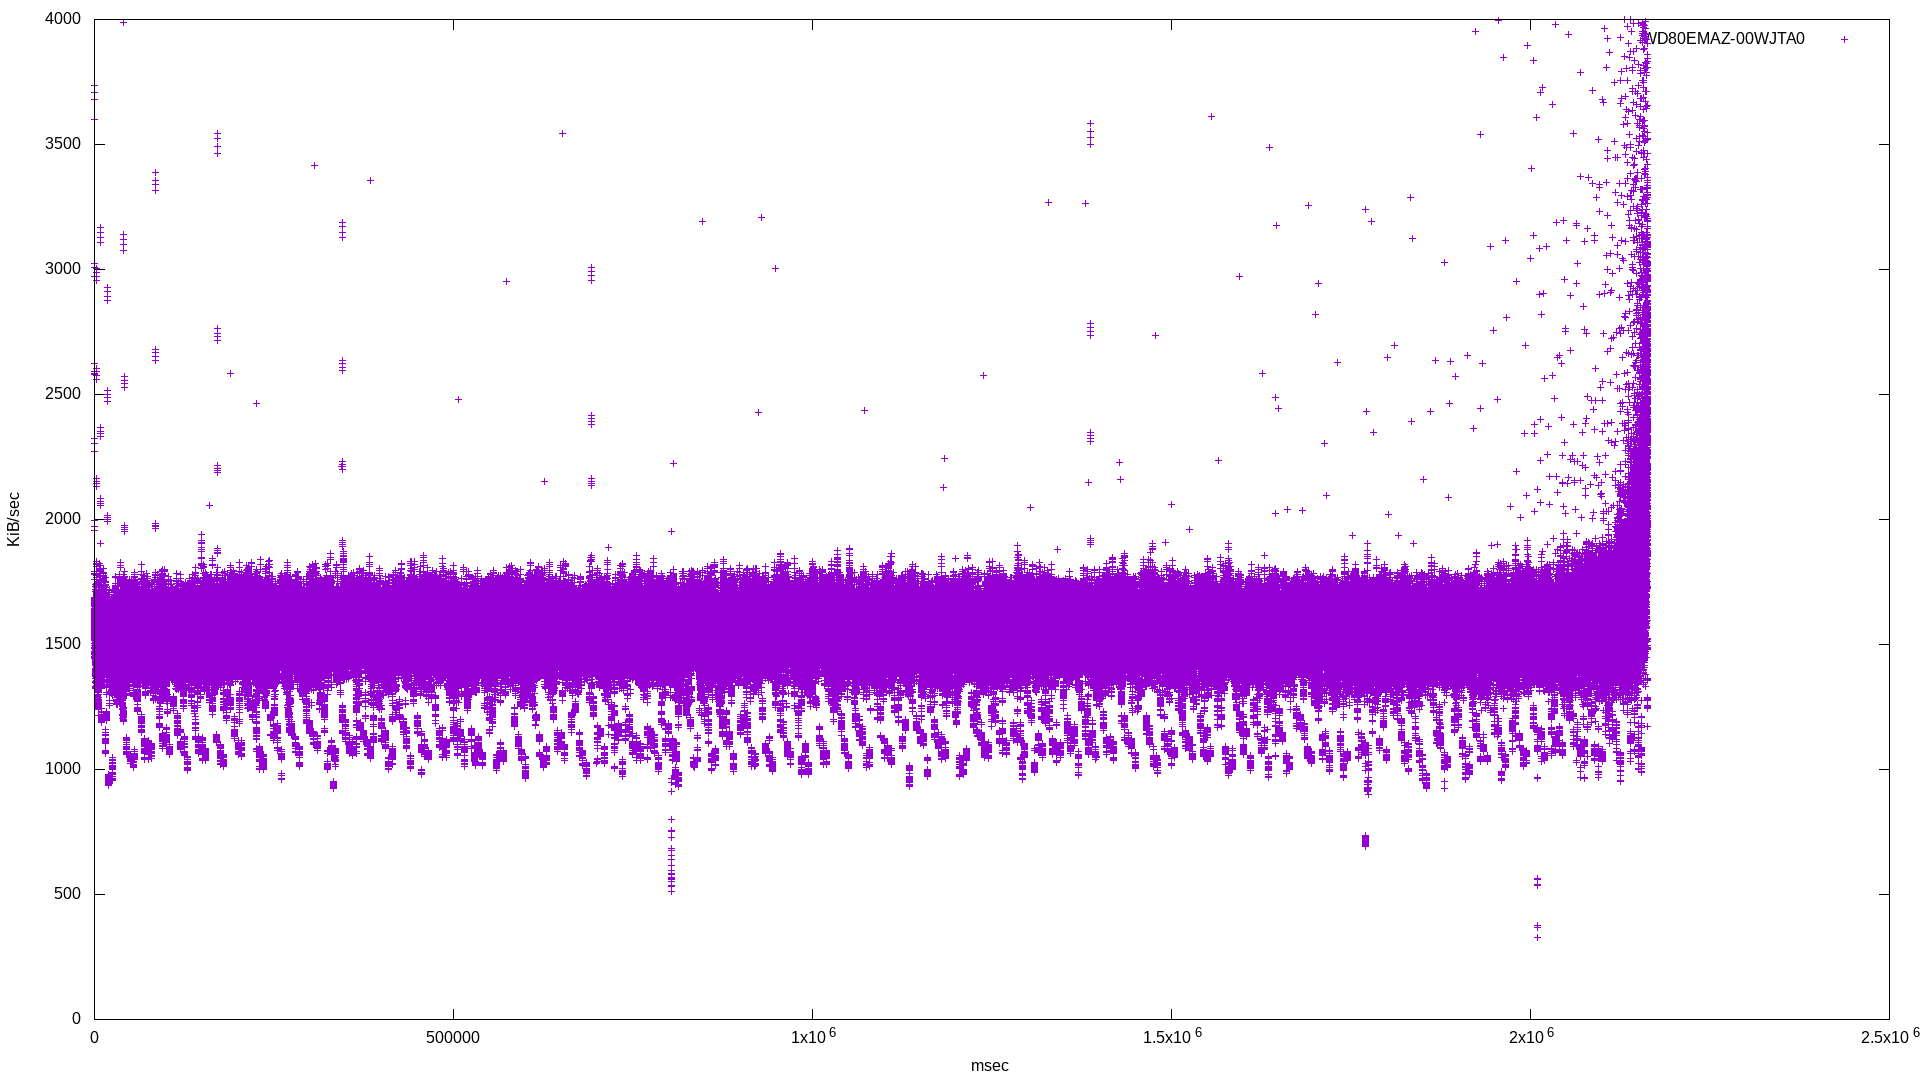
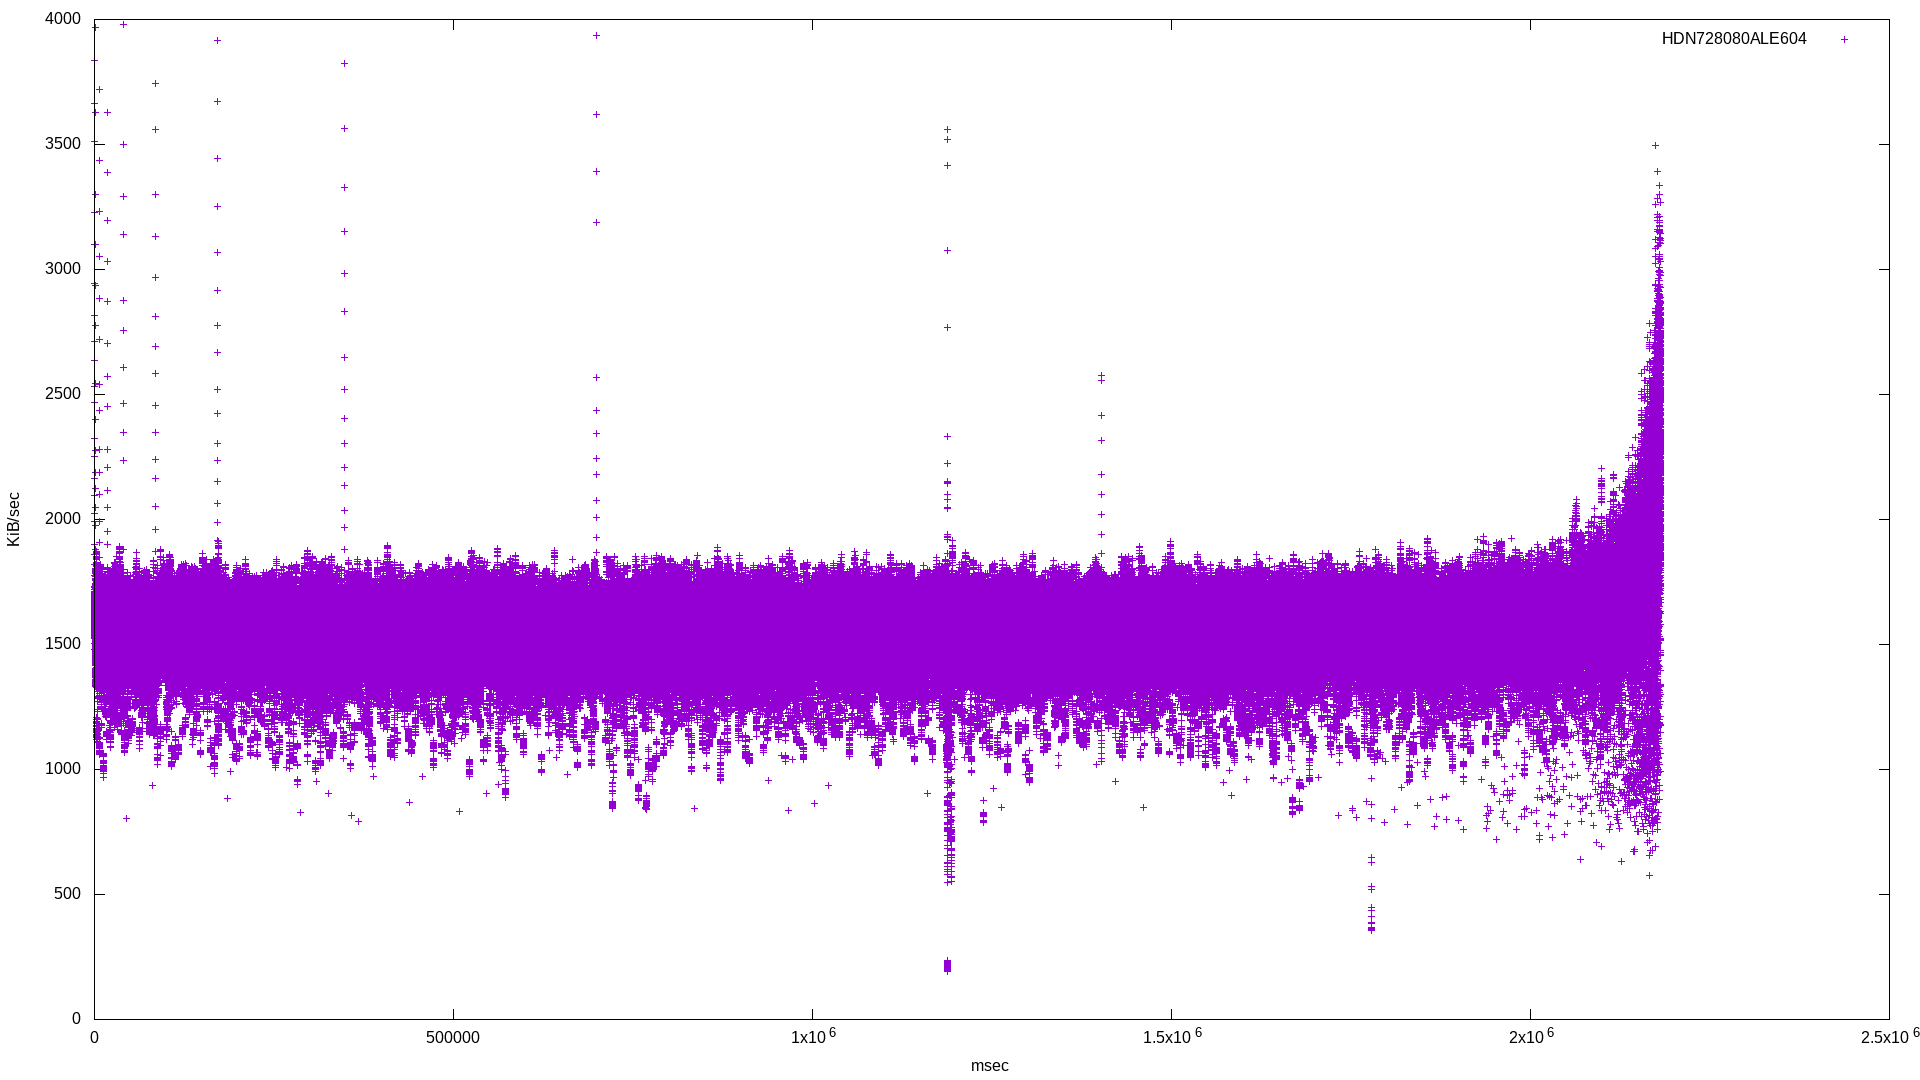
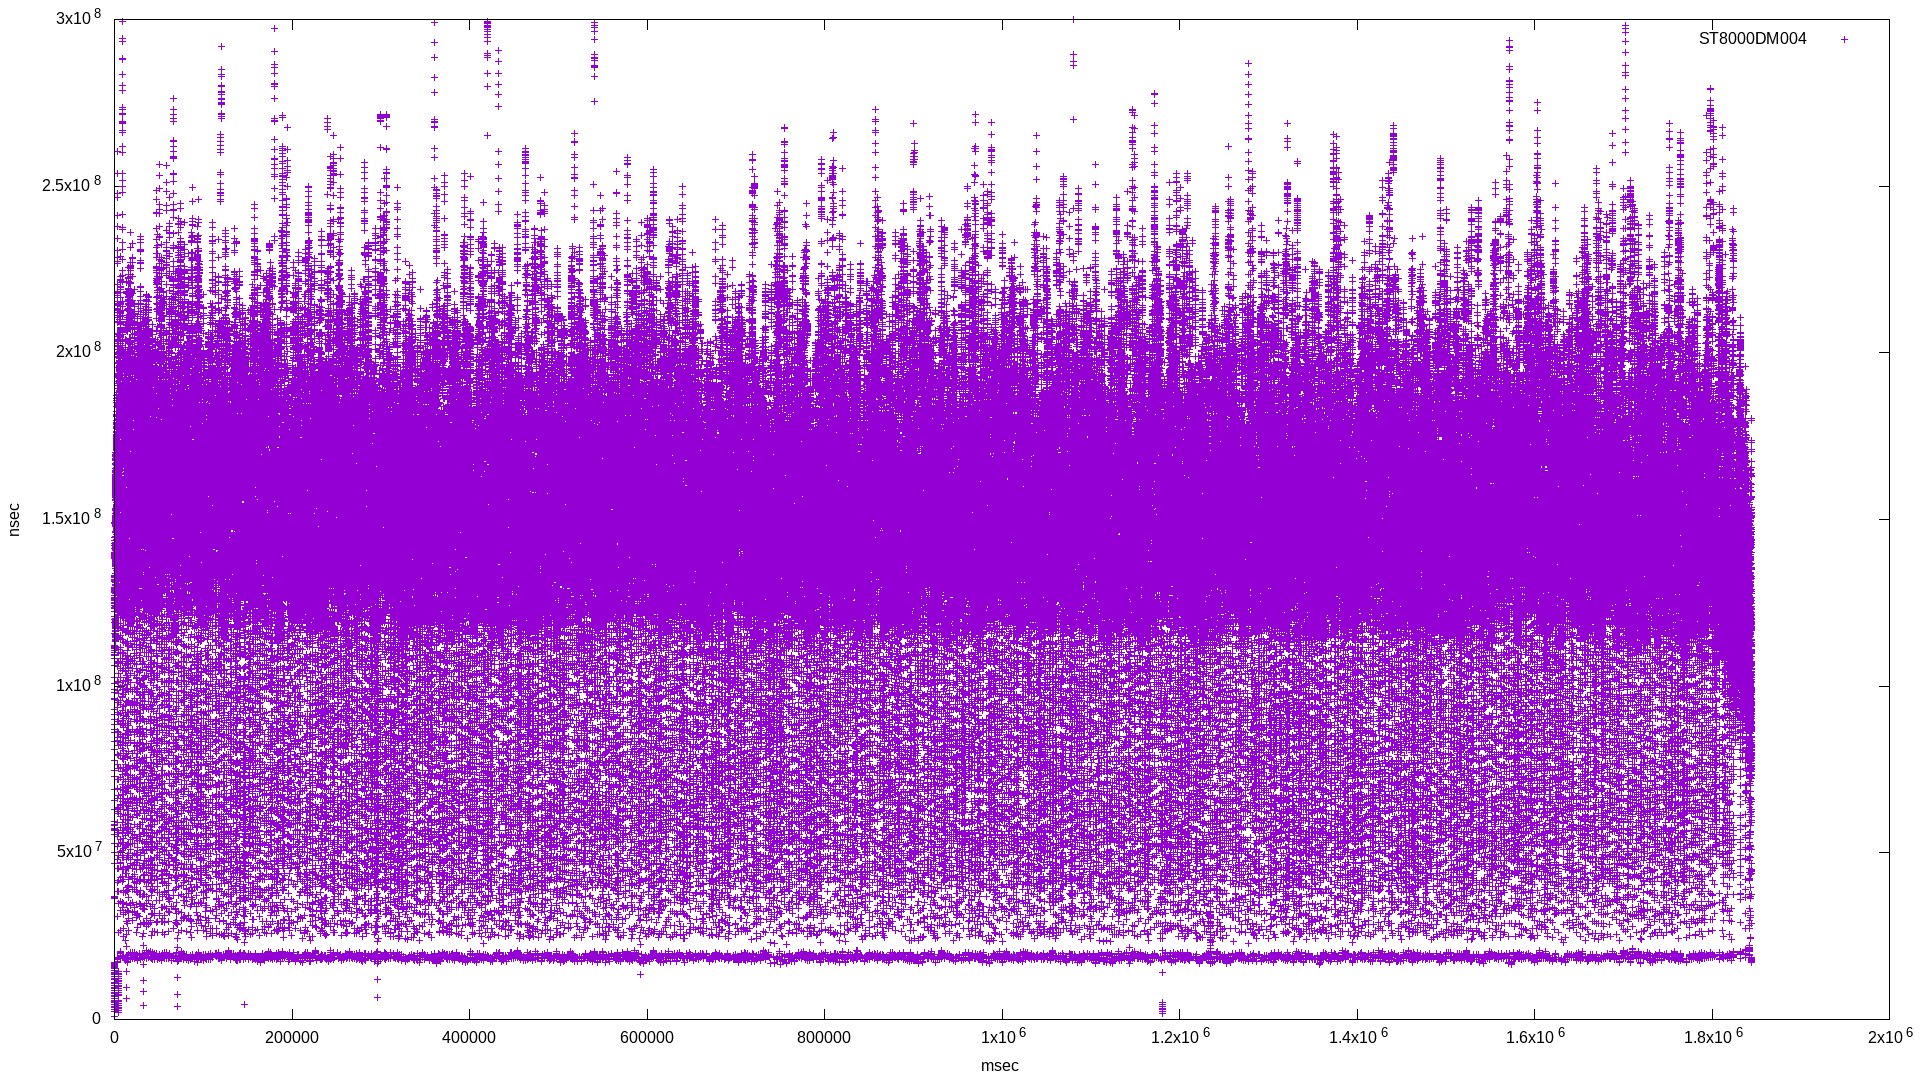
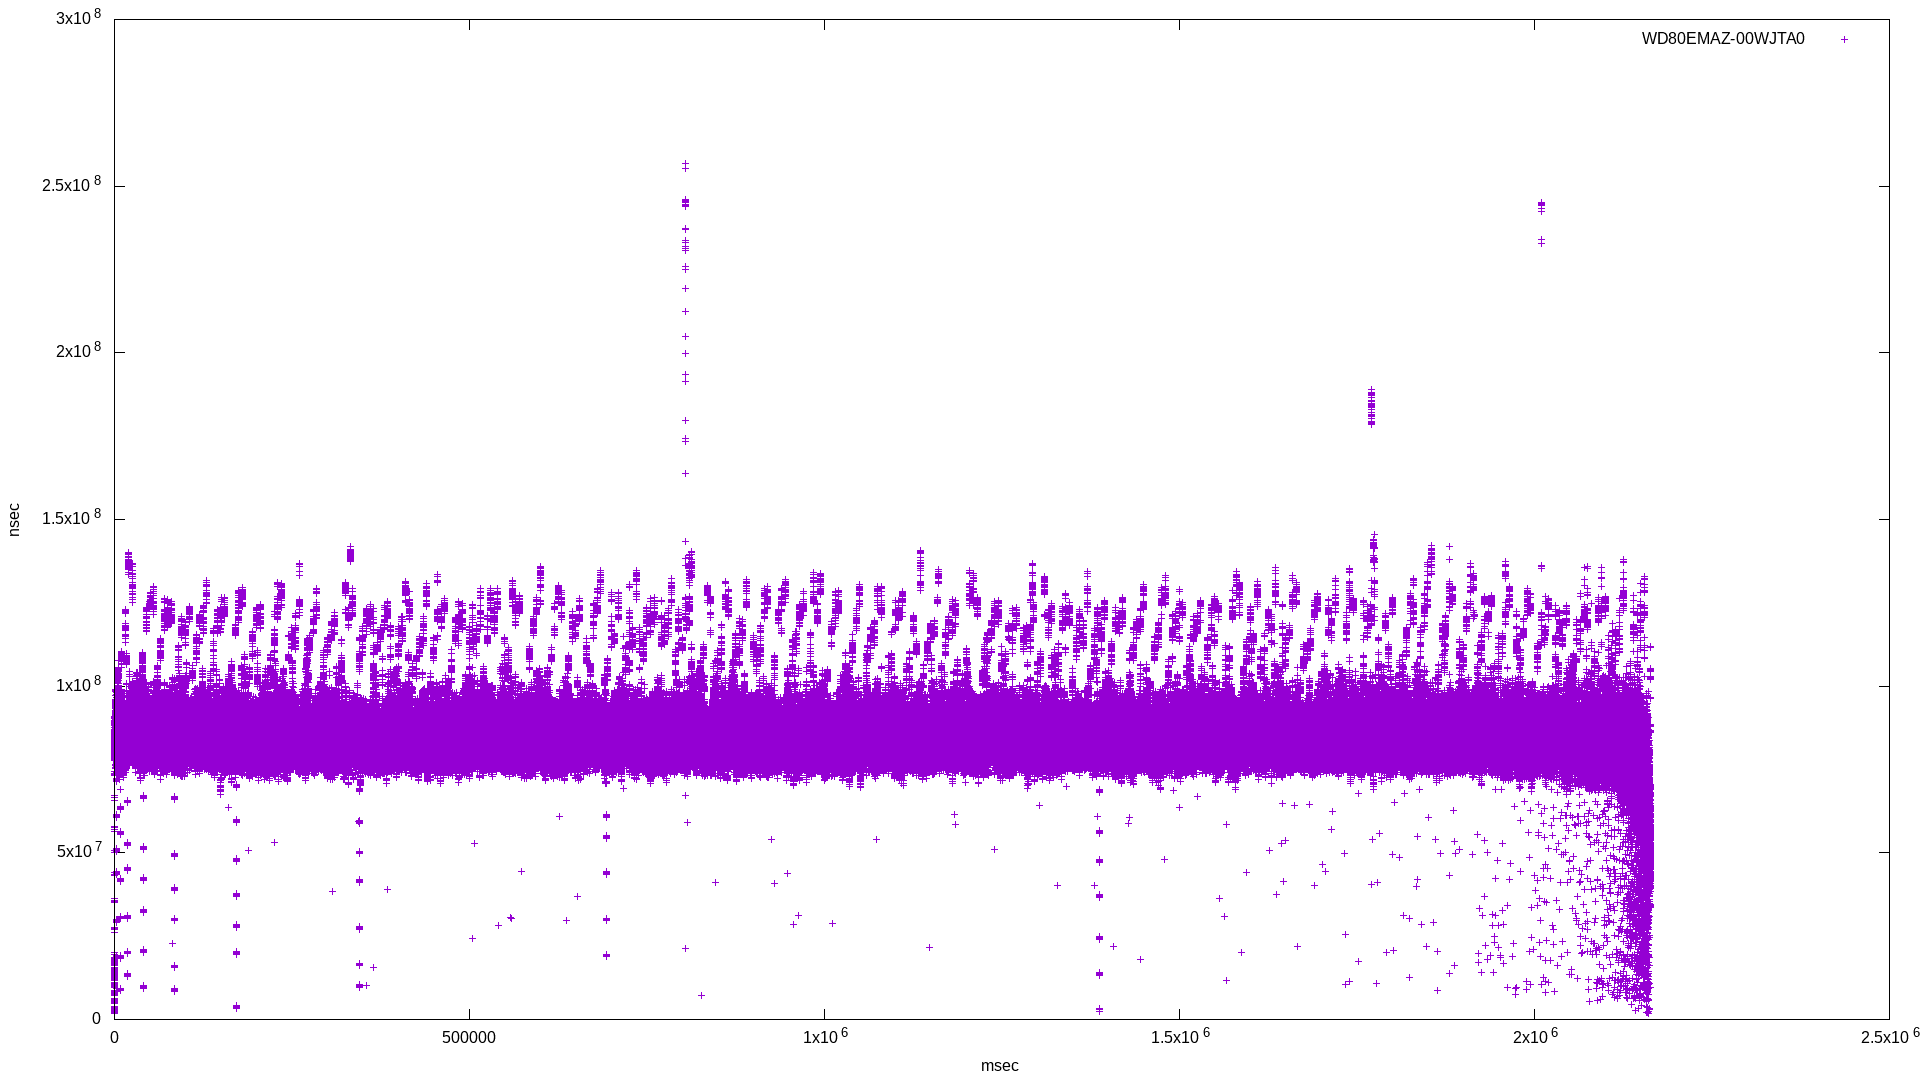
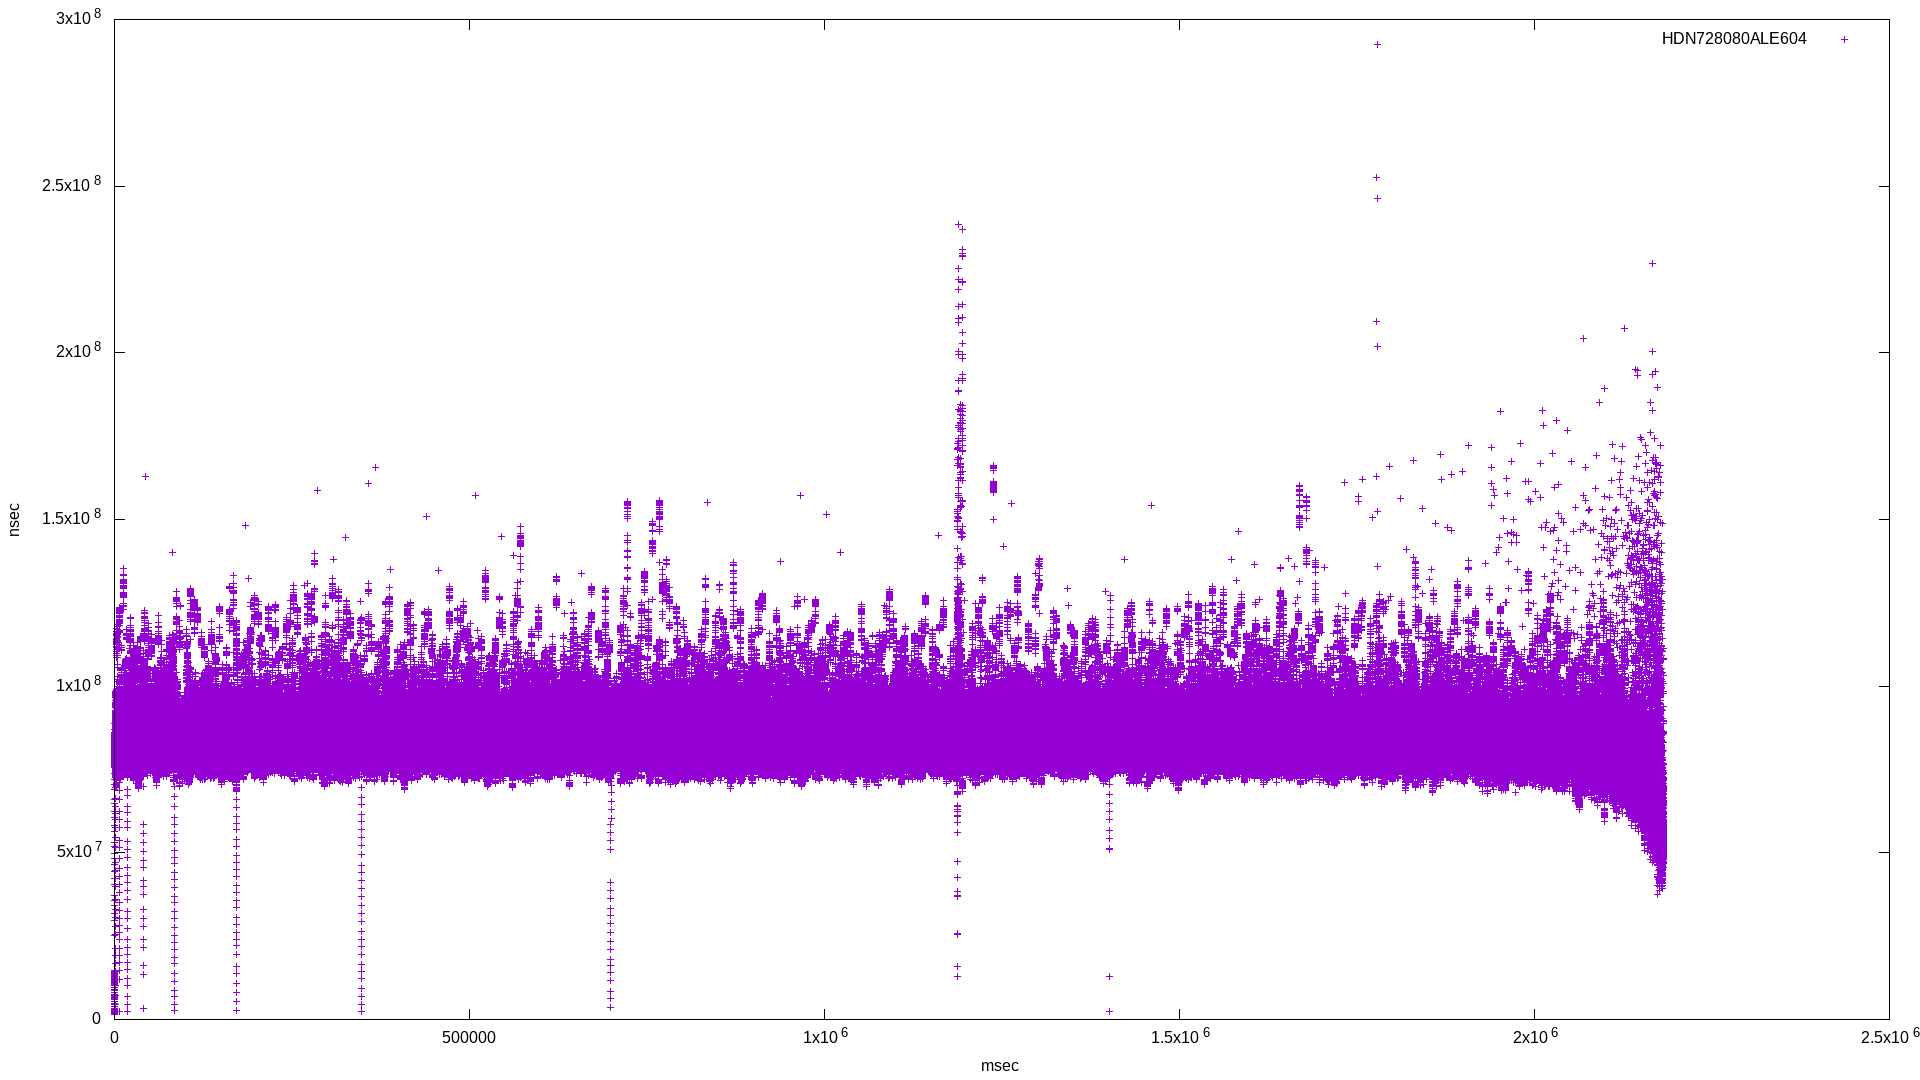
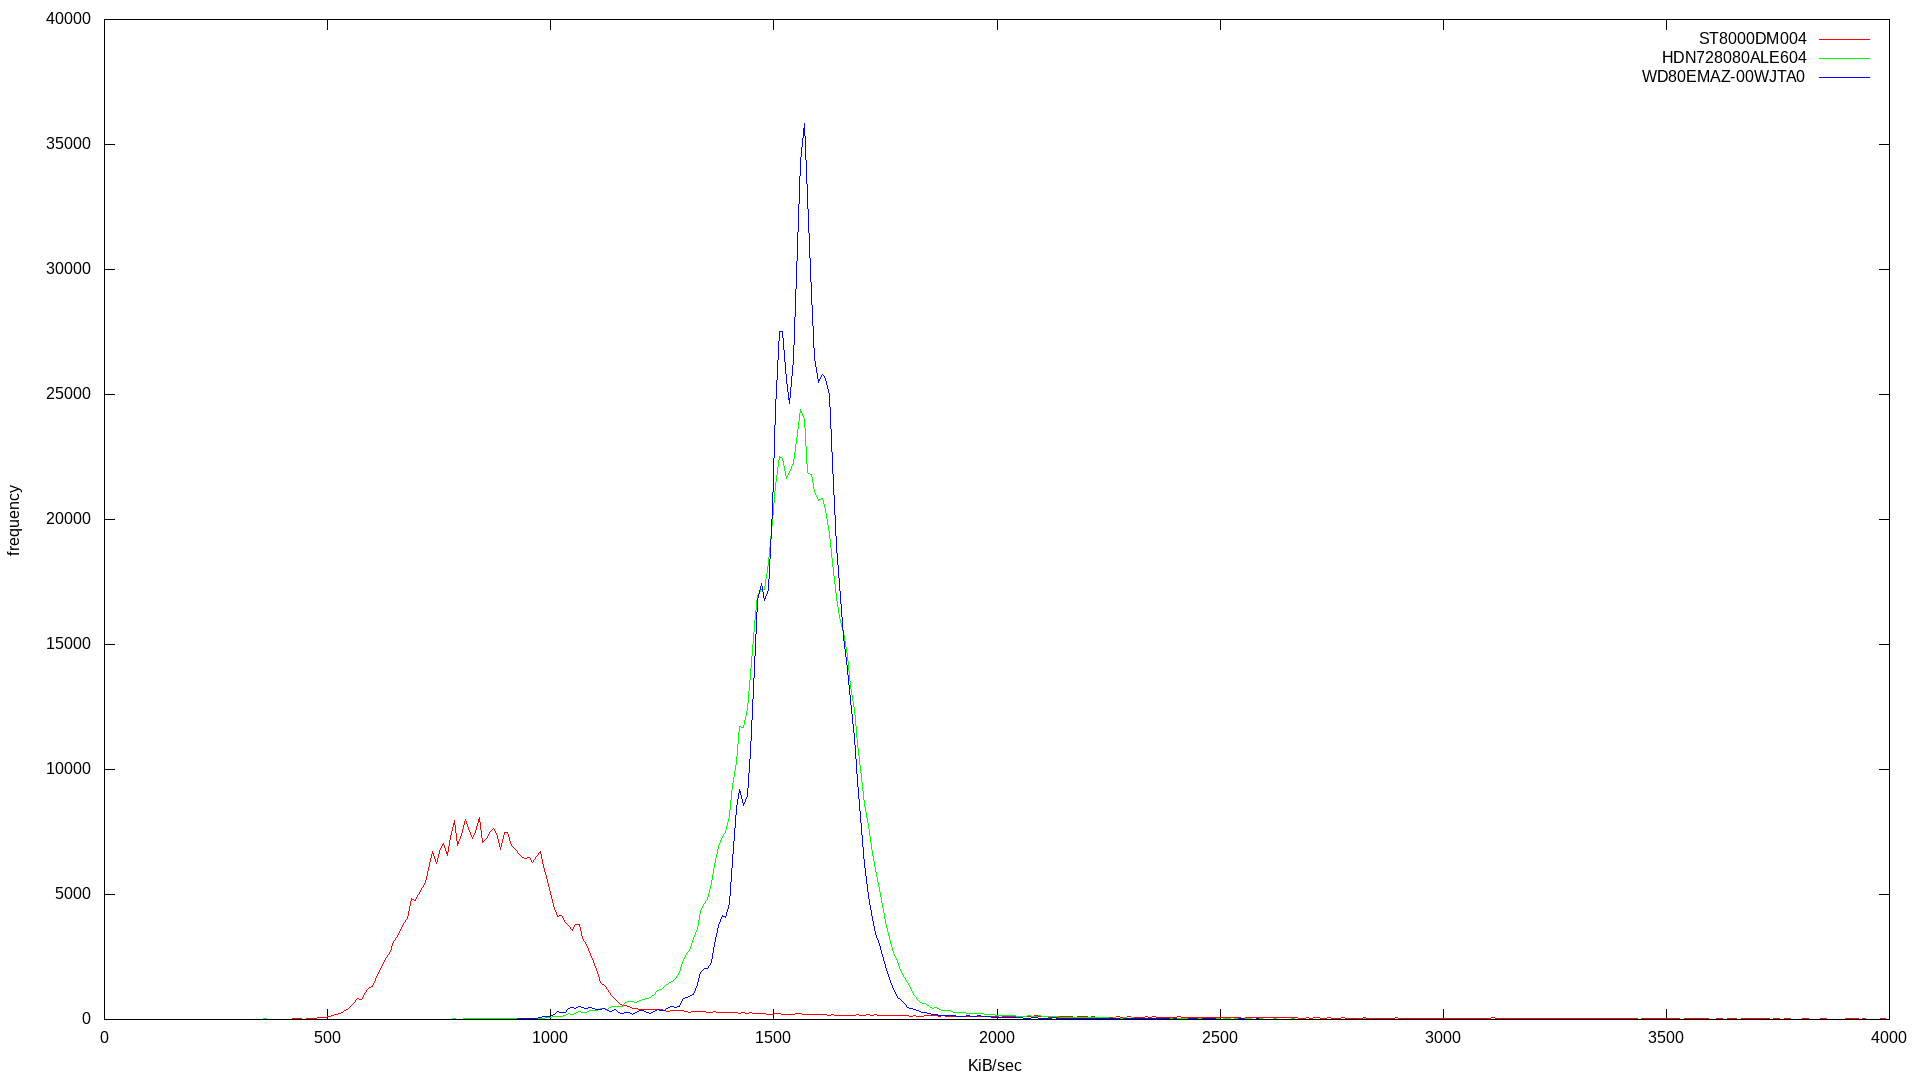
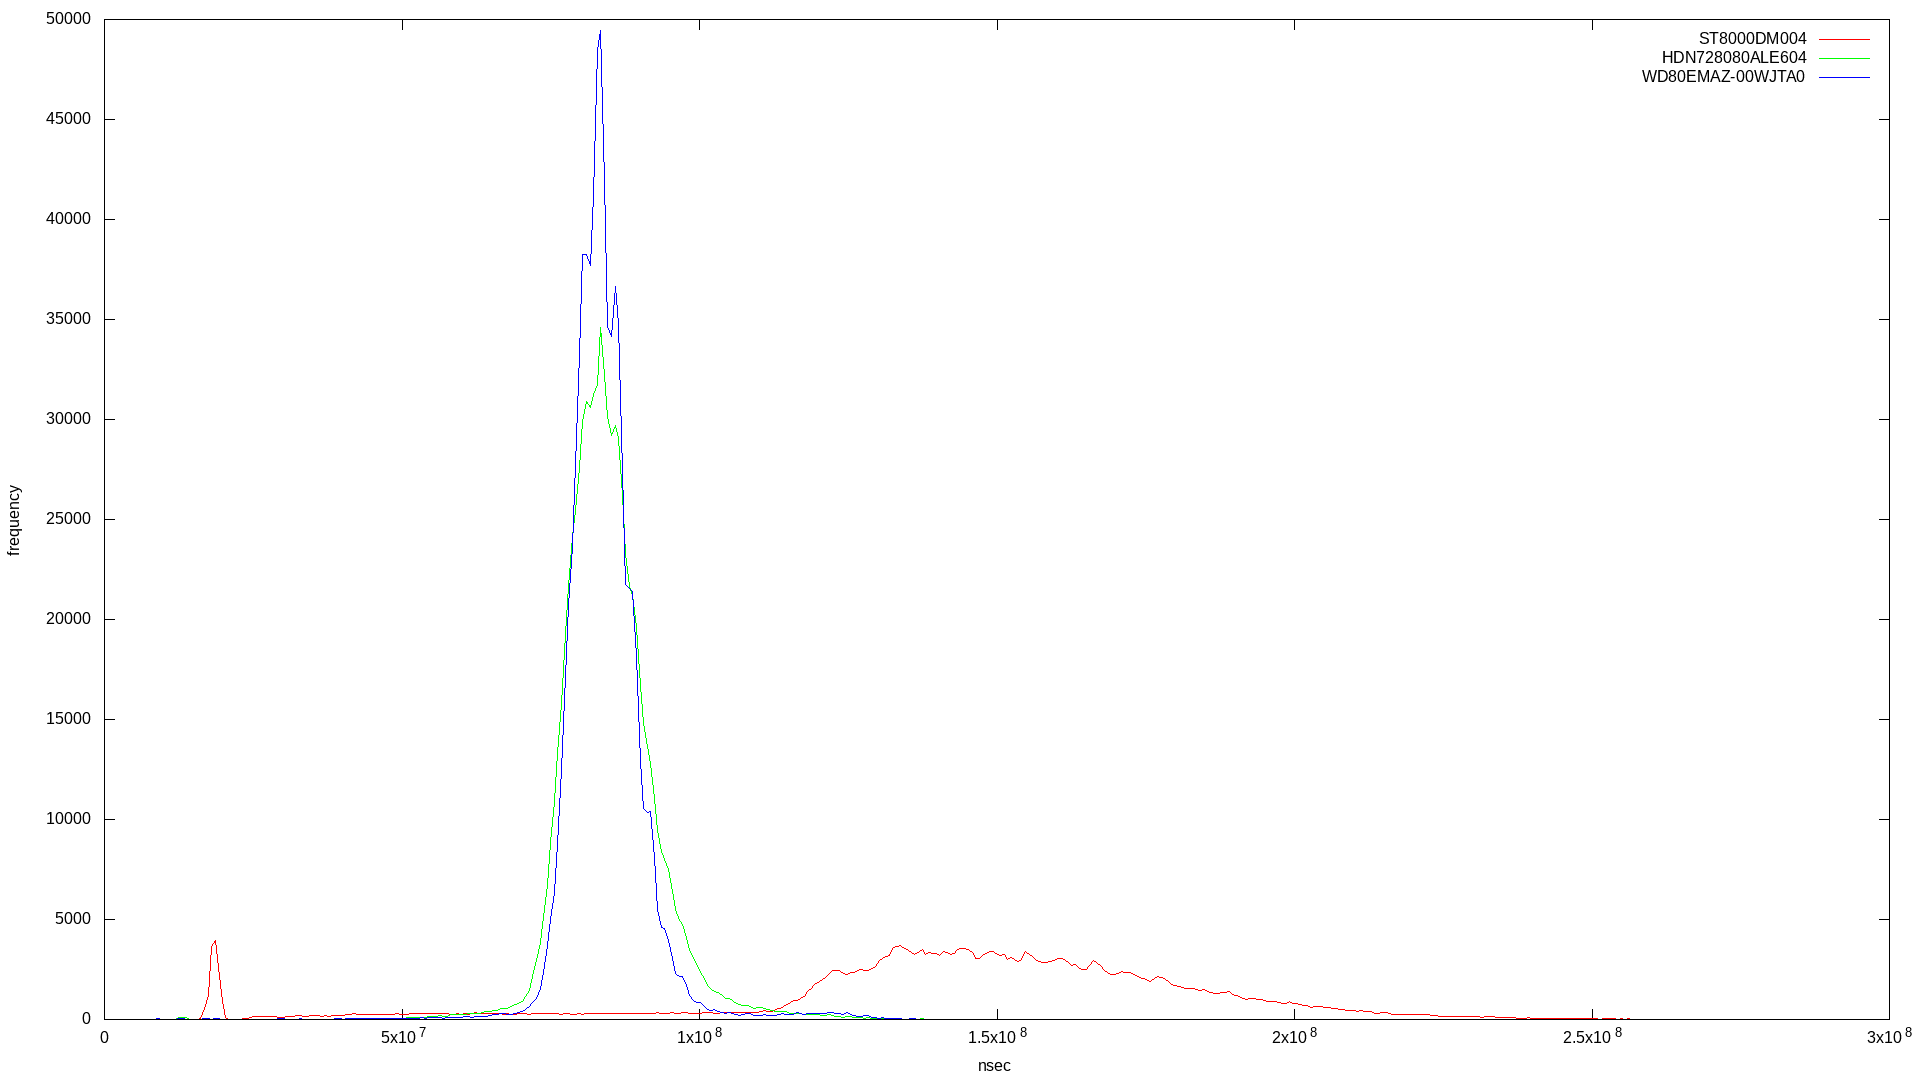
I didn’t want to use multiple threads in order to make the benchmark as isolated as possible. Here are the raw results for bandwidth and latency, followed by the histogram combining results for the three drives:
|
|
|
|
|
|
|
|
|
Already it’s clear which drive is SMR. The SMR drive’s bandwidth histogram shows a broad frequency at lower bandwidth, where the two conventional drives have a tighter frequency around their standard bandwidth.
In the latency histogram, the SMR drive’s latency shows a very broad frequency around 1.5x10⁸, which is around double the CMR drive’s spike at 7x10⁷.
What’s curious is the SMR drive’s low latency spike. Why is this? According to a Western Digital page on SMR:
The property of SMR architecture also allows us to coalesce the data in cache more freely, mainly due to, again, LBA Indirection. Performance can be good when a burst of random writes is sequentialized into a local zone.
This low latency spike could be explained by this caching behaviour. One unanswered question: how durable is this cache?
It should be noted that this SMR drive was pulled from a running NAS. I did not attempt an ATA erase or a TRIM to restore the drive to a blank state before running the above fio tests, and as a result did not reproduce the graph seen in the Anandtech article.
Going back to WD’s SMR page describes how SMR drives can be disorganized:
A simple analogy: Imagine the drive as a warehouse that organizes all your storage for you. As more cartons of various sizes begin to pile in, we need more time to reorganize them. The more we delay the work, the less open space we have to move it around and tidy it up. If we don’t allow for this time, the disorganization will lead to crammed space, low efficiency, and poor response time to locate the right carton.
I suspect my SMR drive is one that is thoroughly disorganized in this way. What do the same SMR drive’s bandwidth and latency graphs look like after an ATA secure erase? I decided to try it.
Here’s the fio job description:
[global]
rw=write
bs=128k
size=8t
ioengine=libaio
iodepth=32
direct=1
write_bw_log
write_lat_log
Note that it spans the whole capacity of the drive.
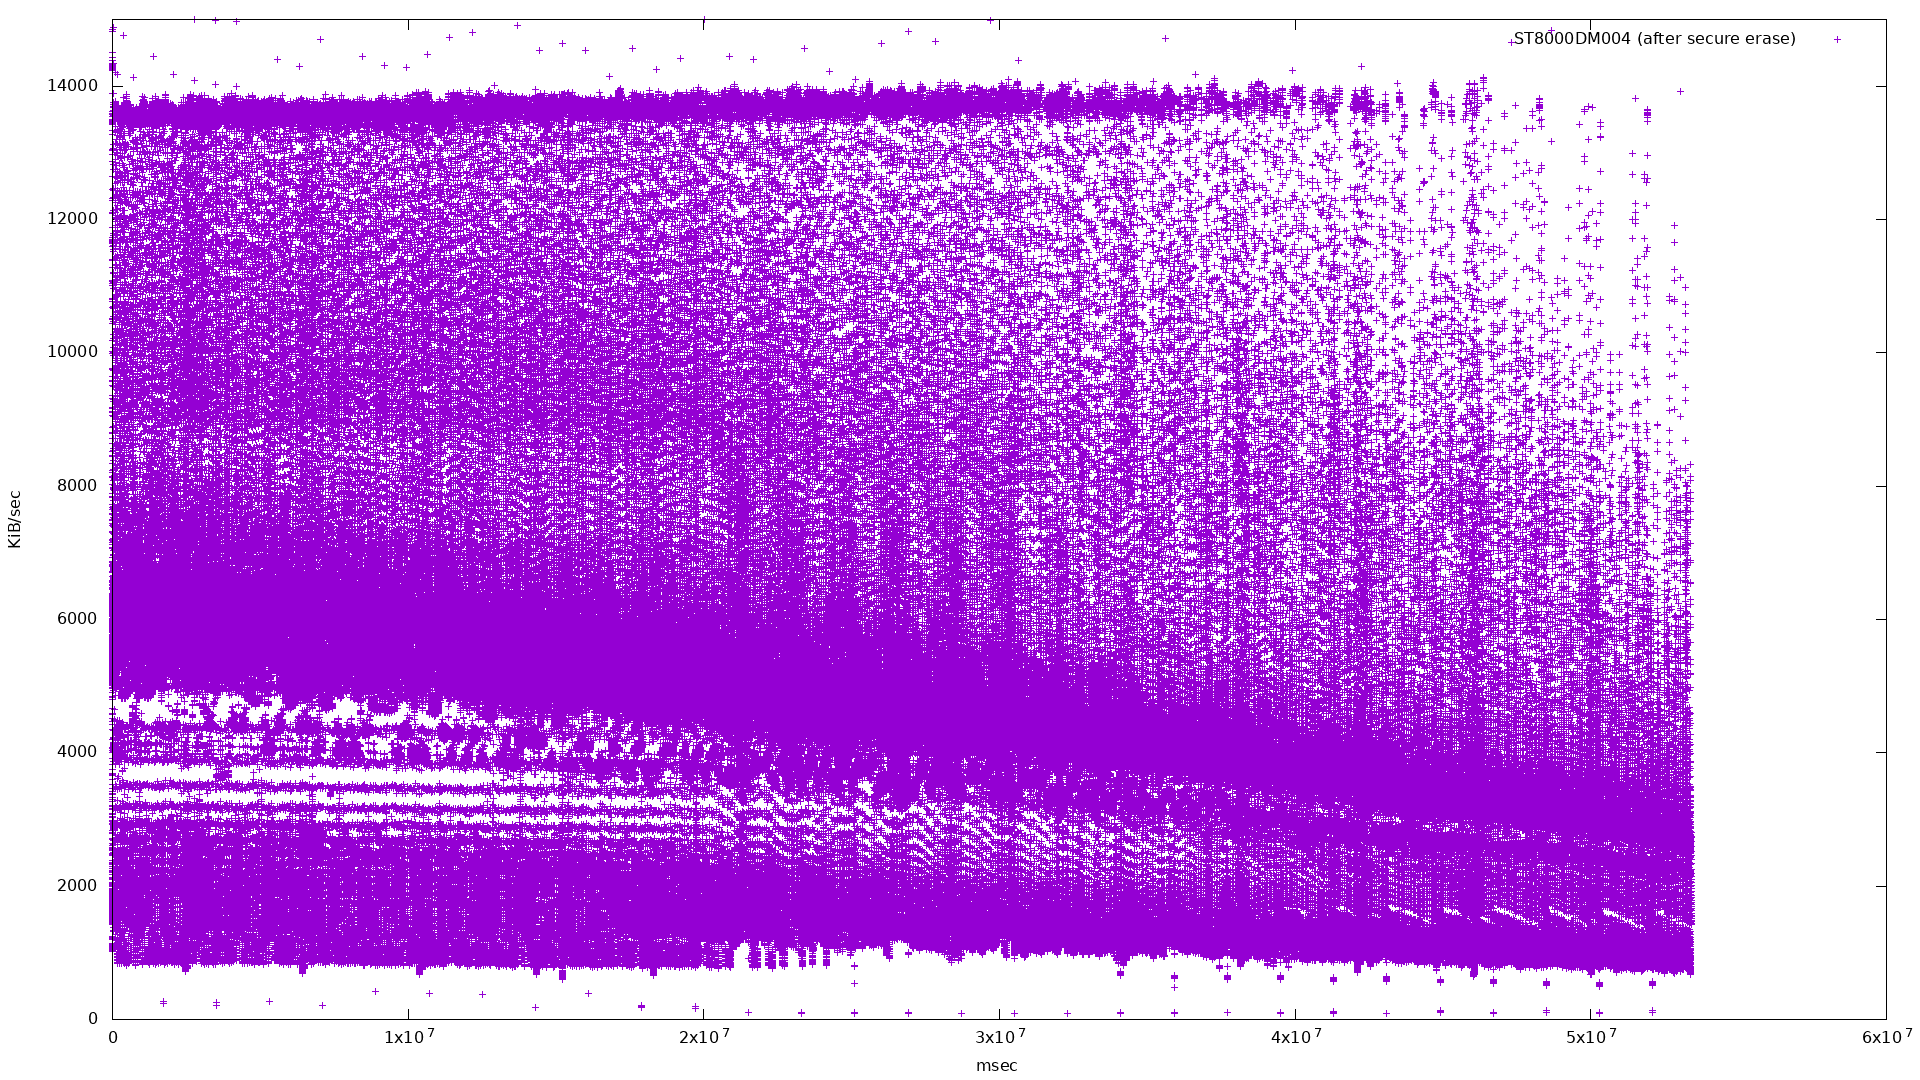
|
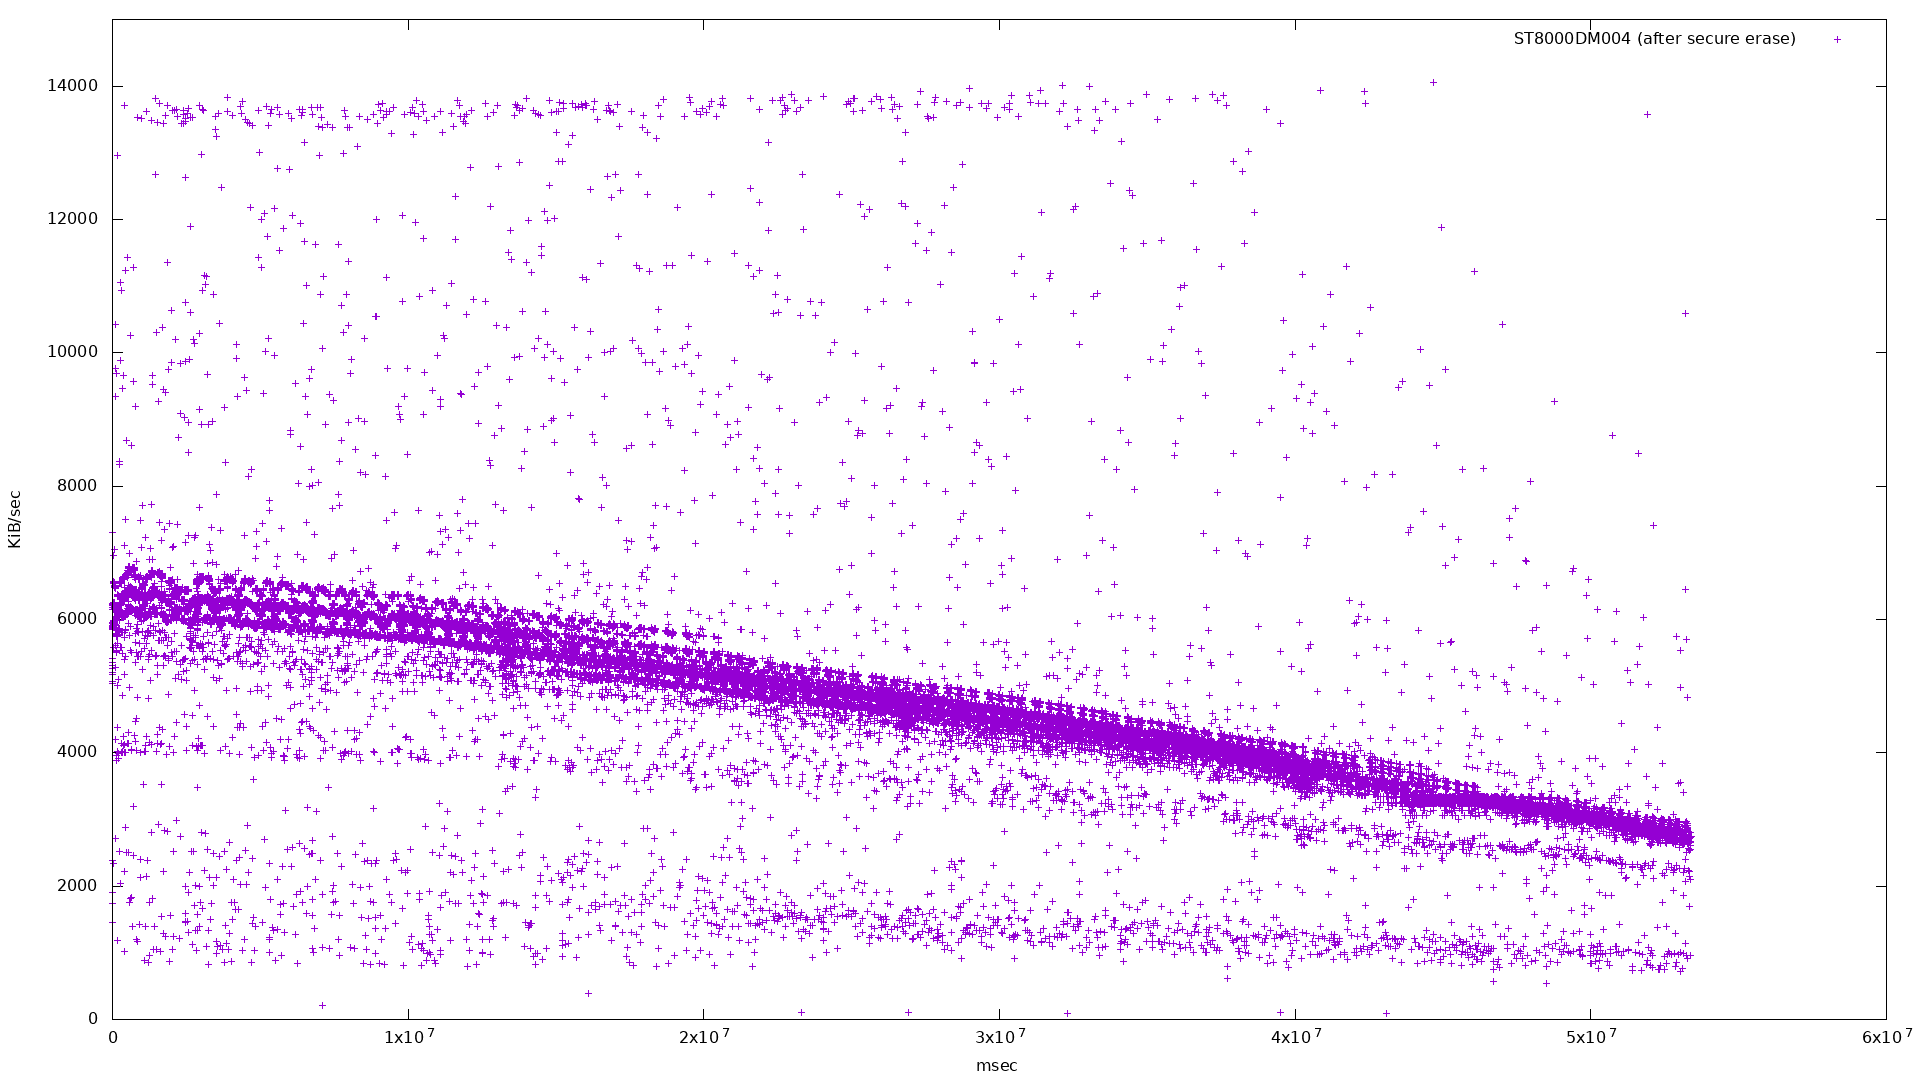
Taking every 100th point cleans up the graph a bit:
|
|
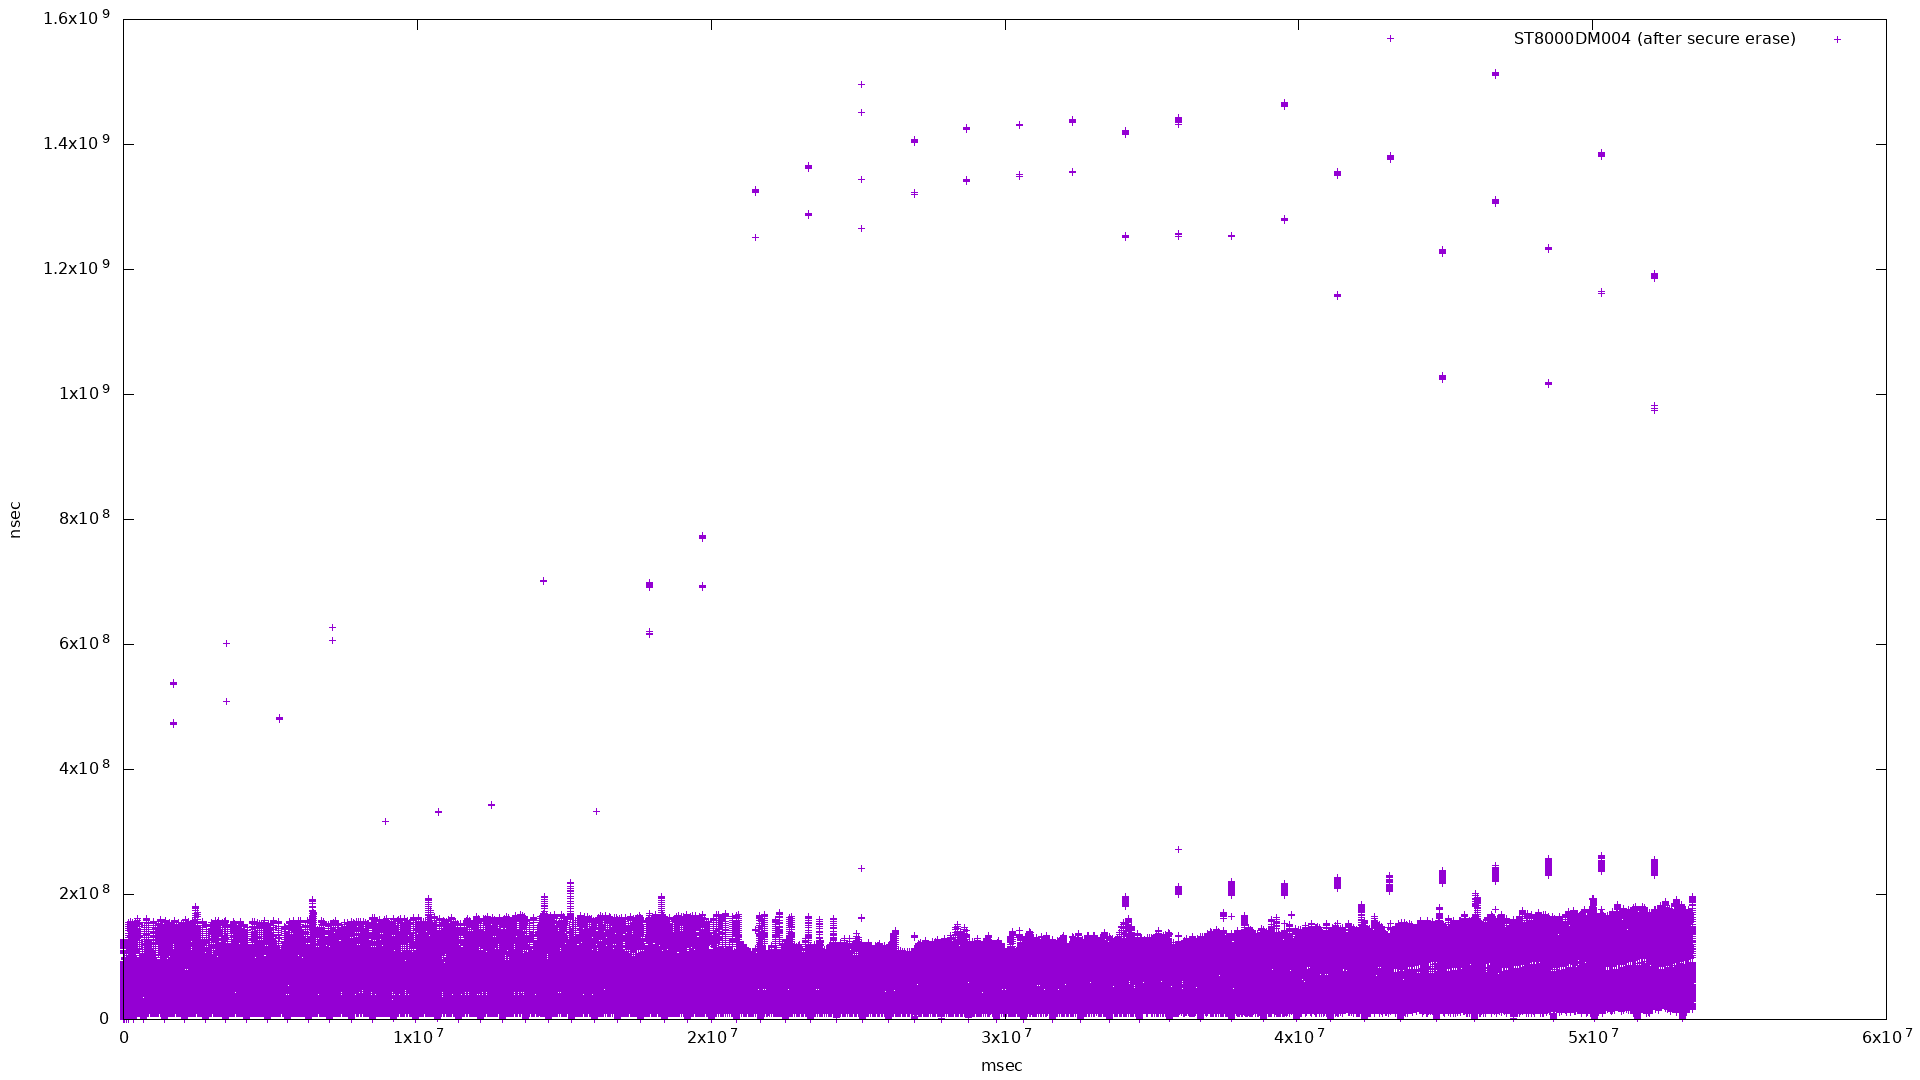
Not very interesting - here it is limited to showing below 3x10⁸:
|
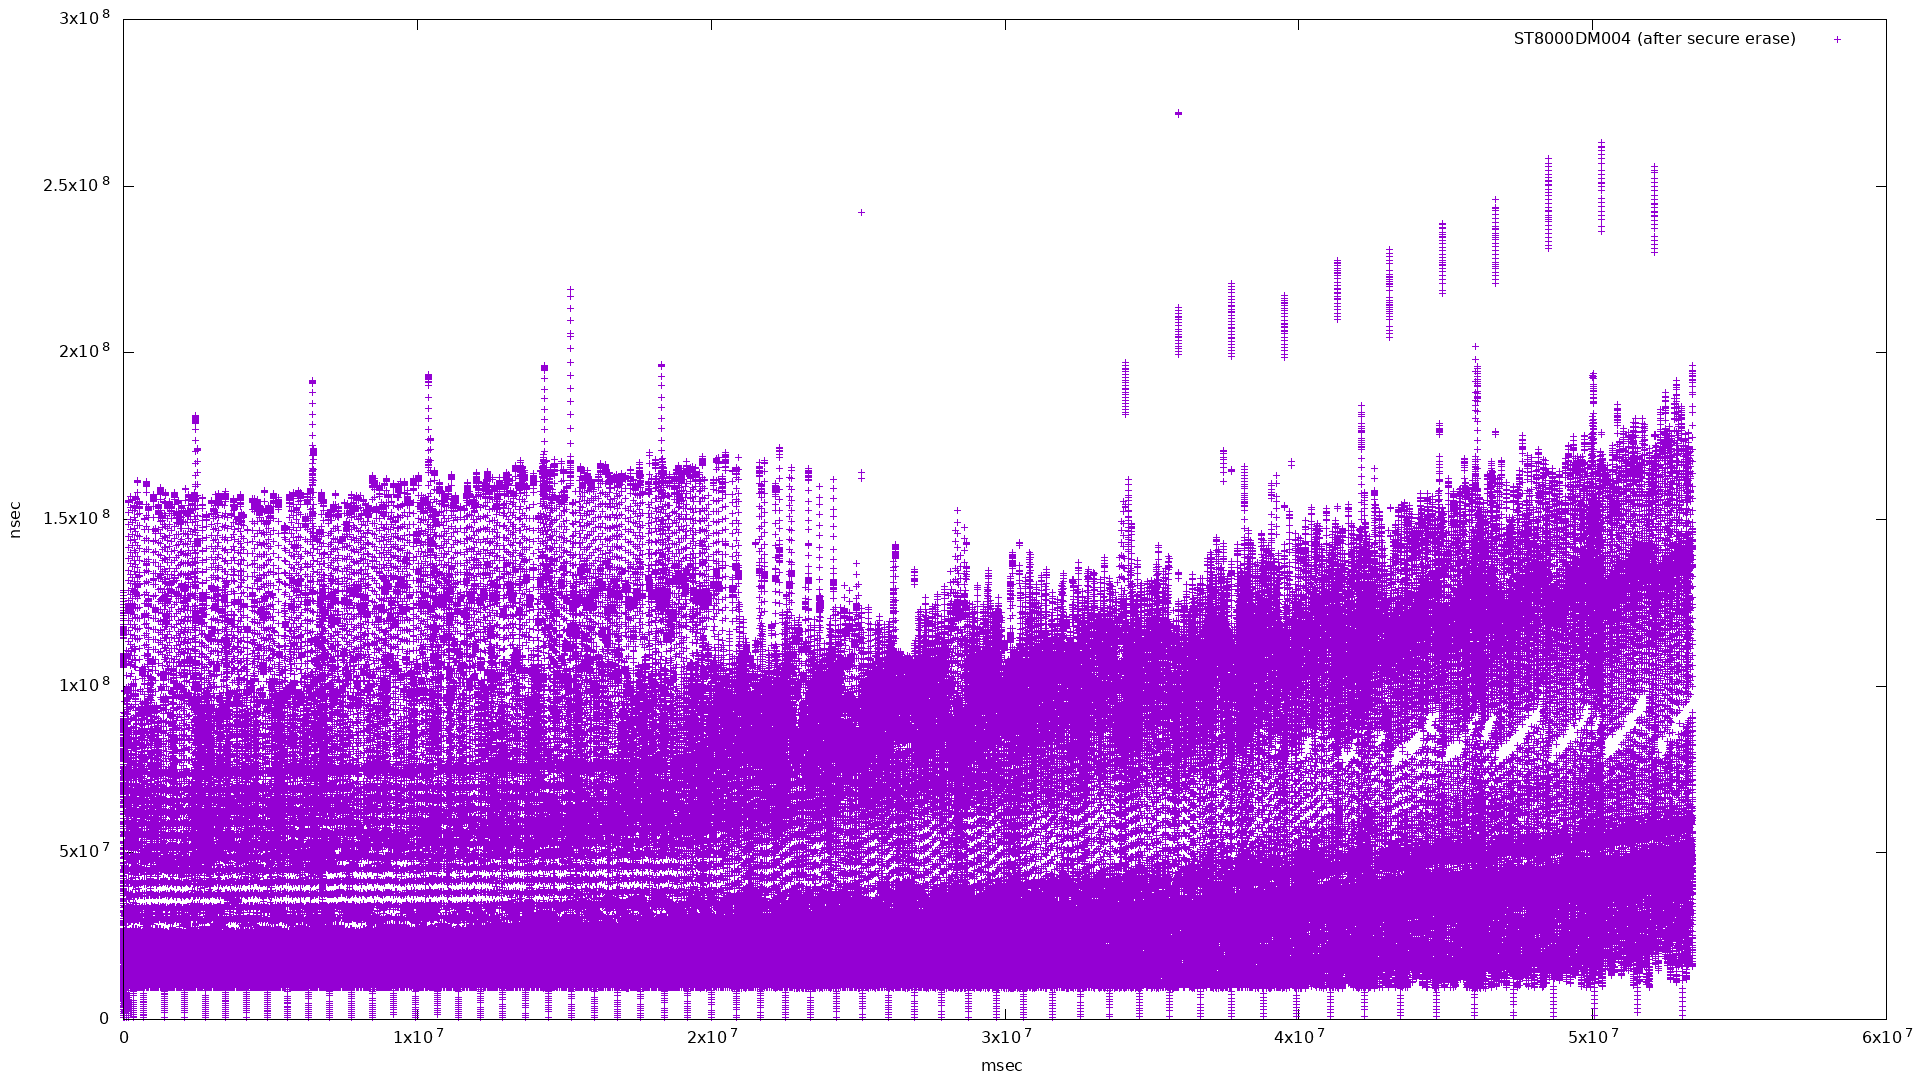
and again, taking every 100th point:
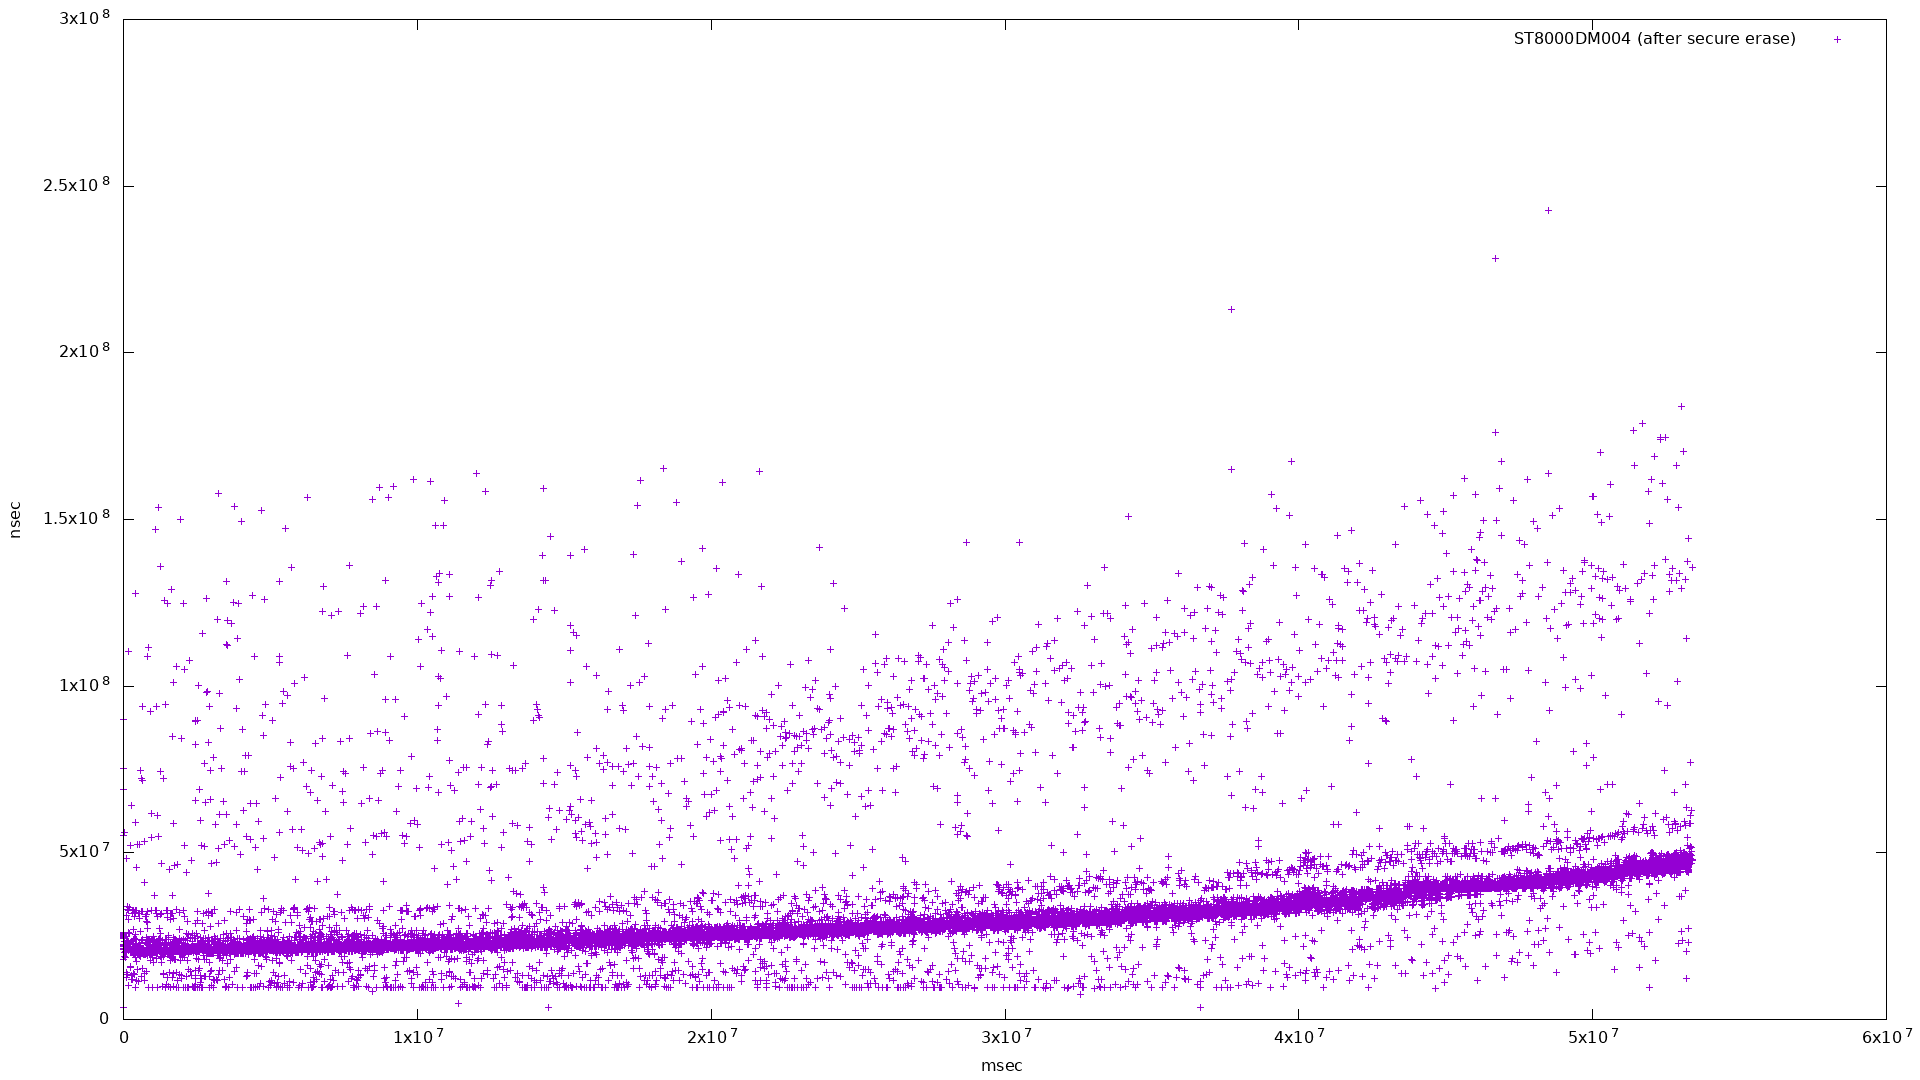
|
Unfortunately I was unable to reproduce the graph seen in the Anandtech article.
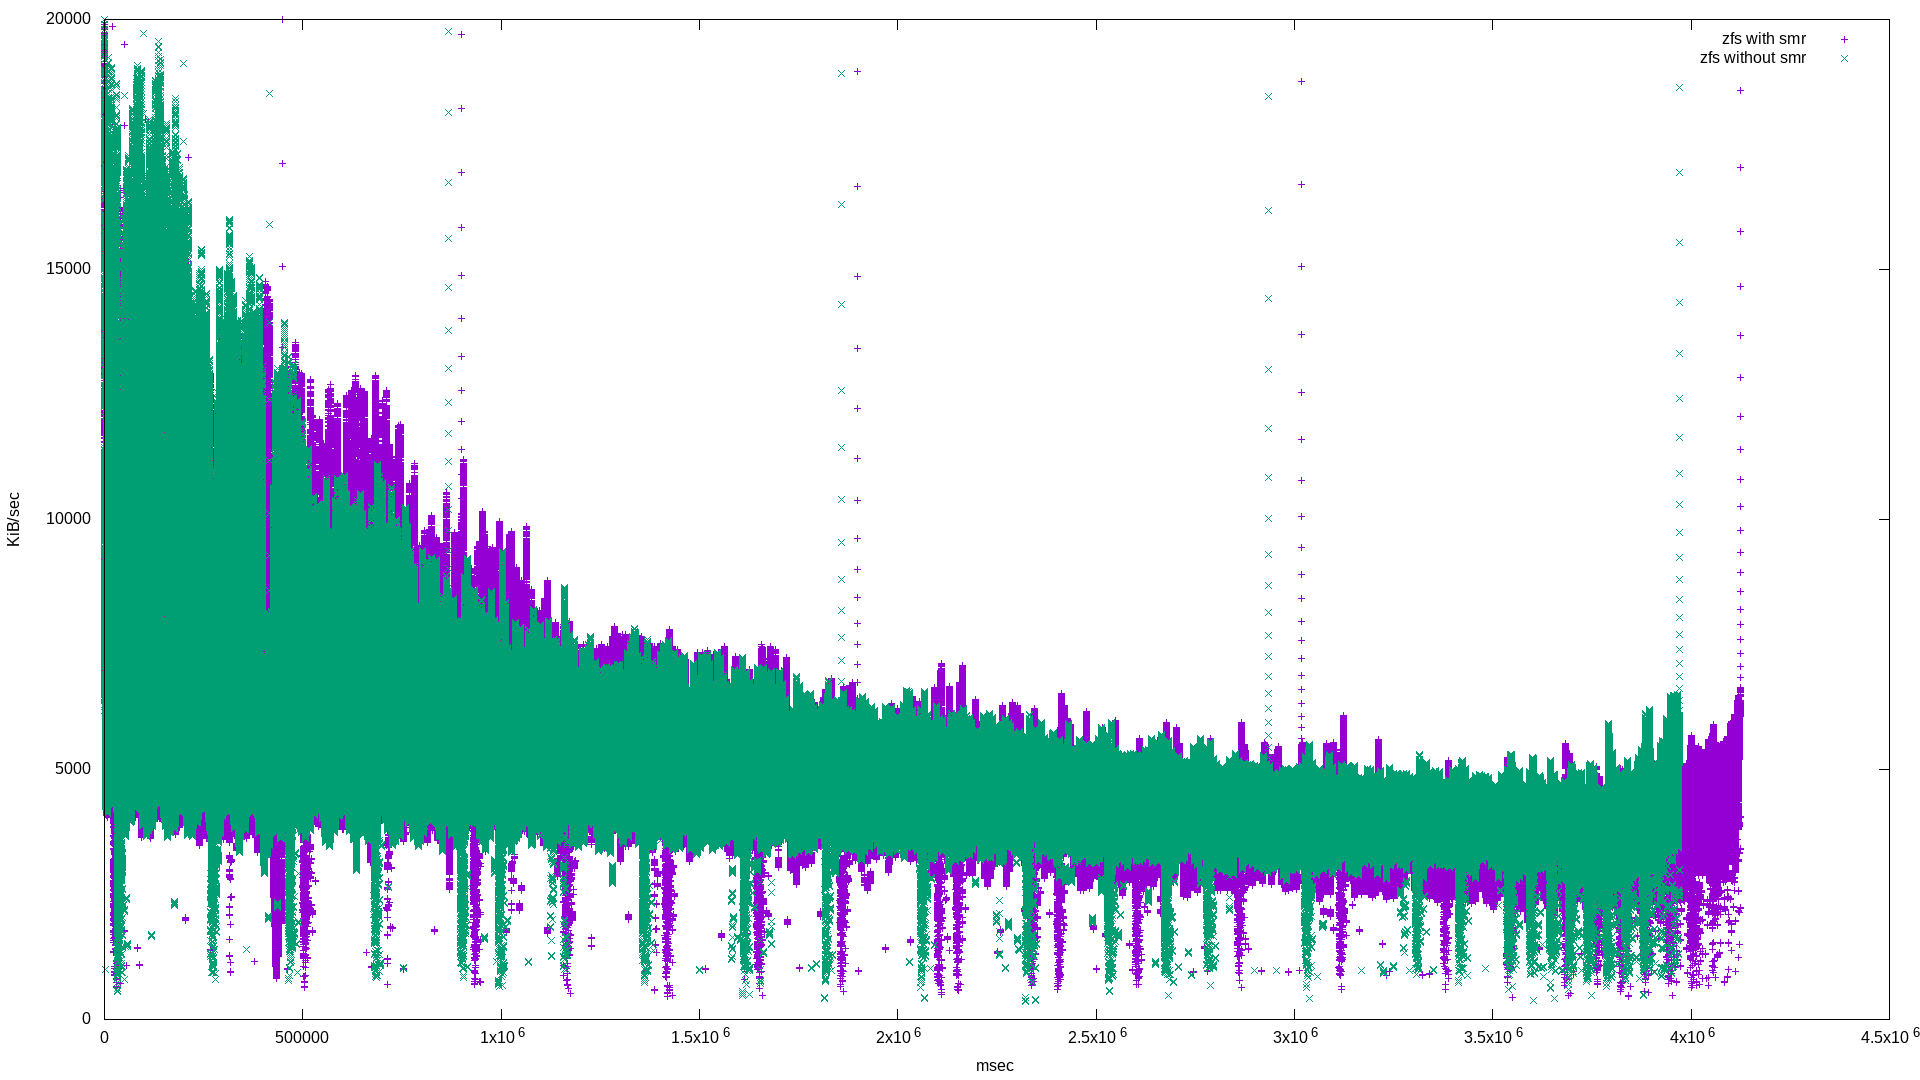
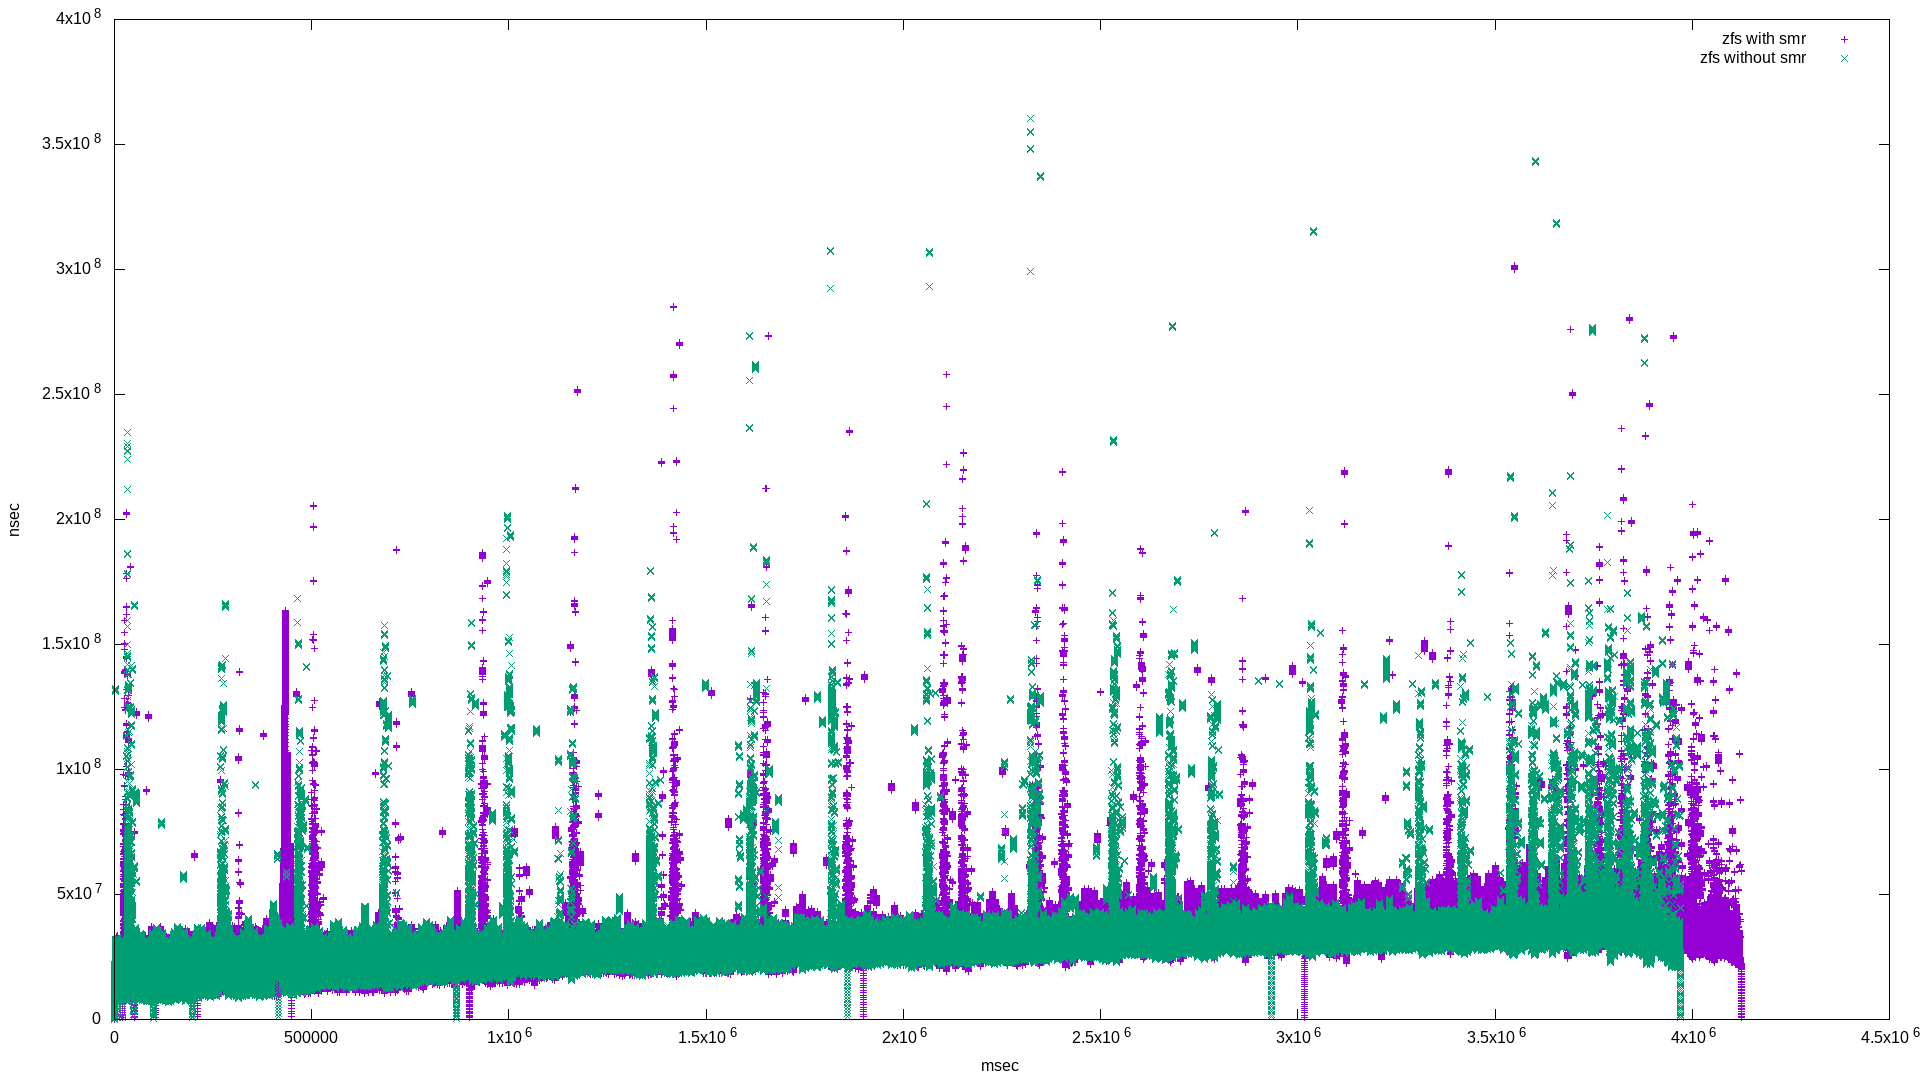
But what about the impact to ZFS? The SMR drive was functioning in a ZFS vdev consisting of three mirrored disks. I created two zpools:
$ sudo zpool create testpost mirror \
    /dev/disk/by-id/ata-HGST_HDN728080ALE604_... \
    /dev/disk/by-id/ata-ST8000DM004-2CX188_...
$ sudo zpool create posttest mirror \
    /dev/disk/by-id/ata-HGST_HDN728080ALE604_... \
    /dev/disk/by-id/ata-WDC_WD80EMAZ-00WJTA0_...
testpost contains the SMR disk. I ran the following fio job
description:
[global]
rw=randwrite
bs=128k
size=500g
ioengine=libaio
iodepth=32
write_bw_log
write_lat_log

[zfs_with_smr]
filename=/testpost/bigfile
Instead of directly interacting with the disk(s), this benchmark creates a file and performs the random write workload on it.
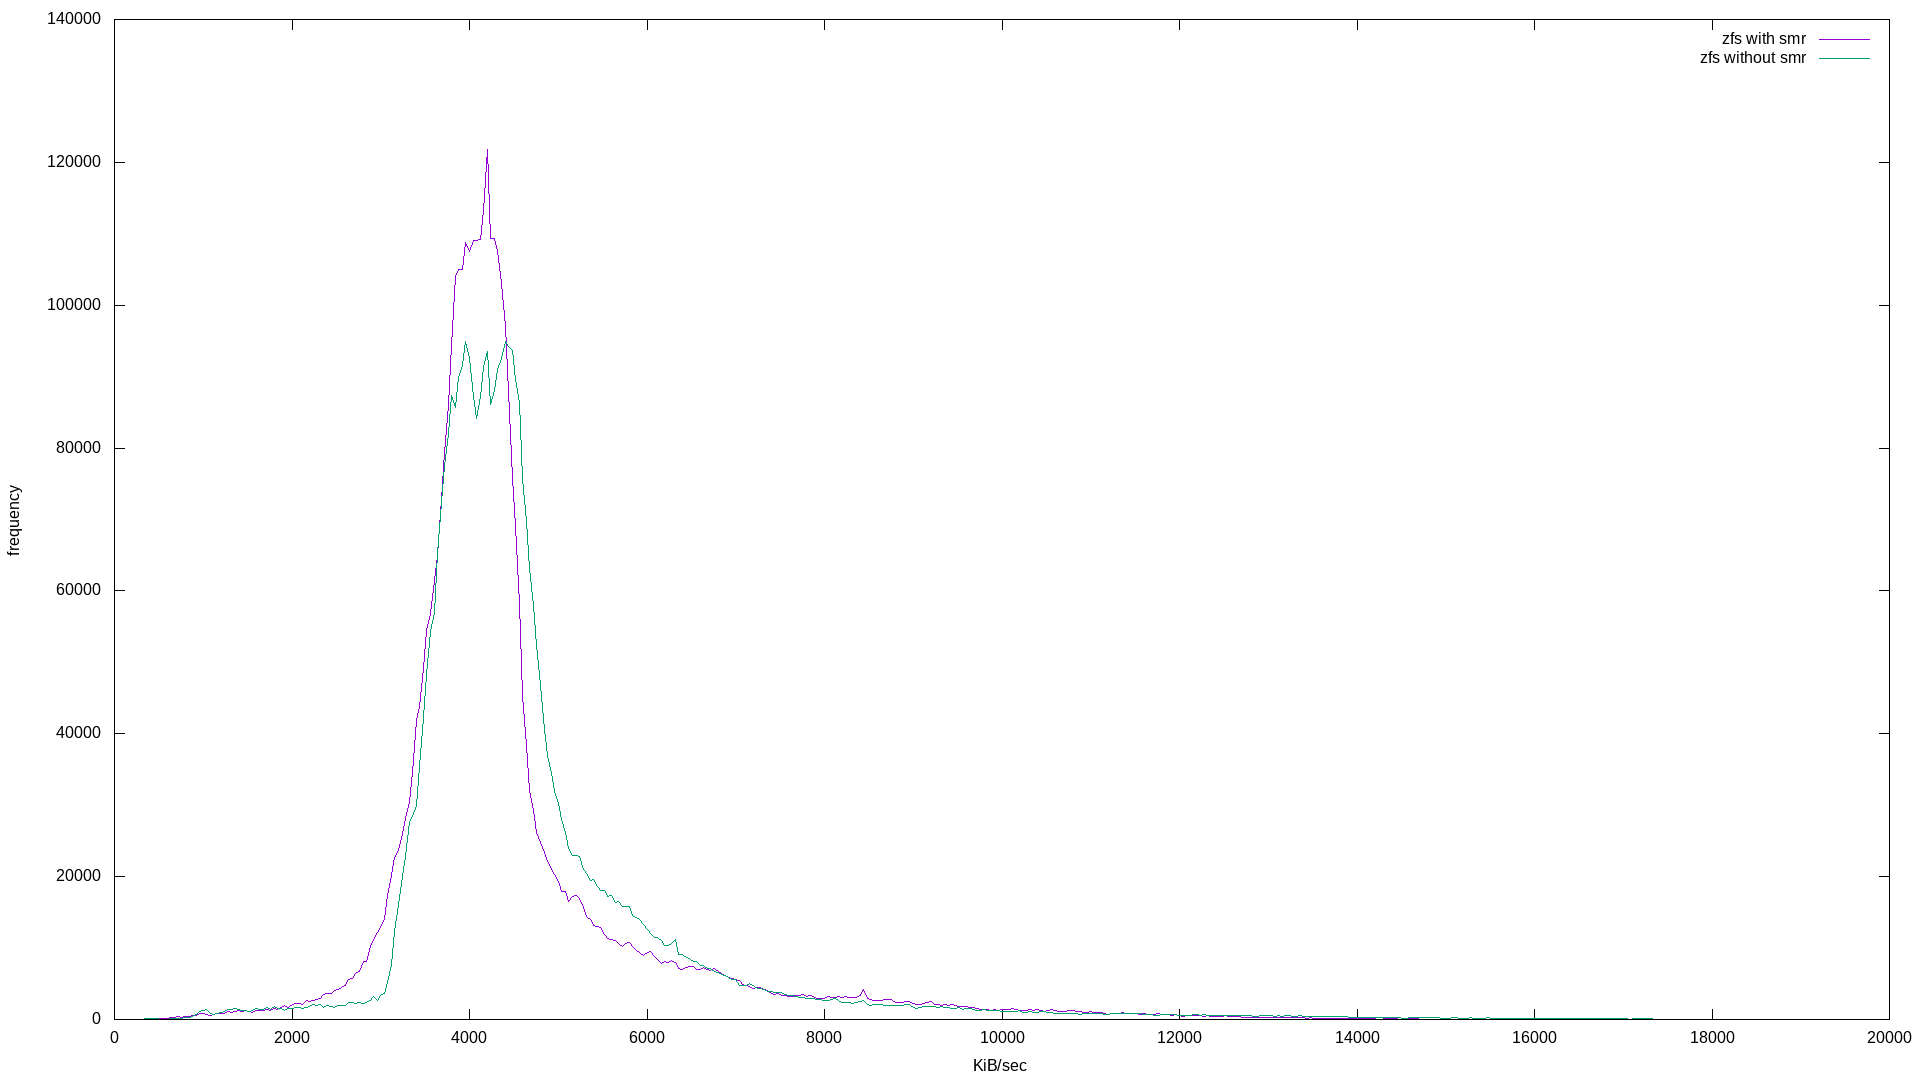
Below are the results:
|
|
|
|
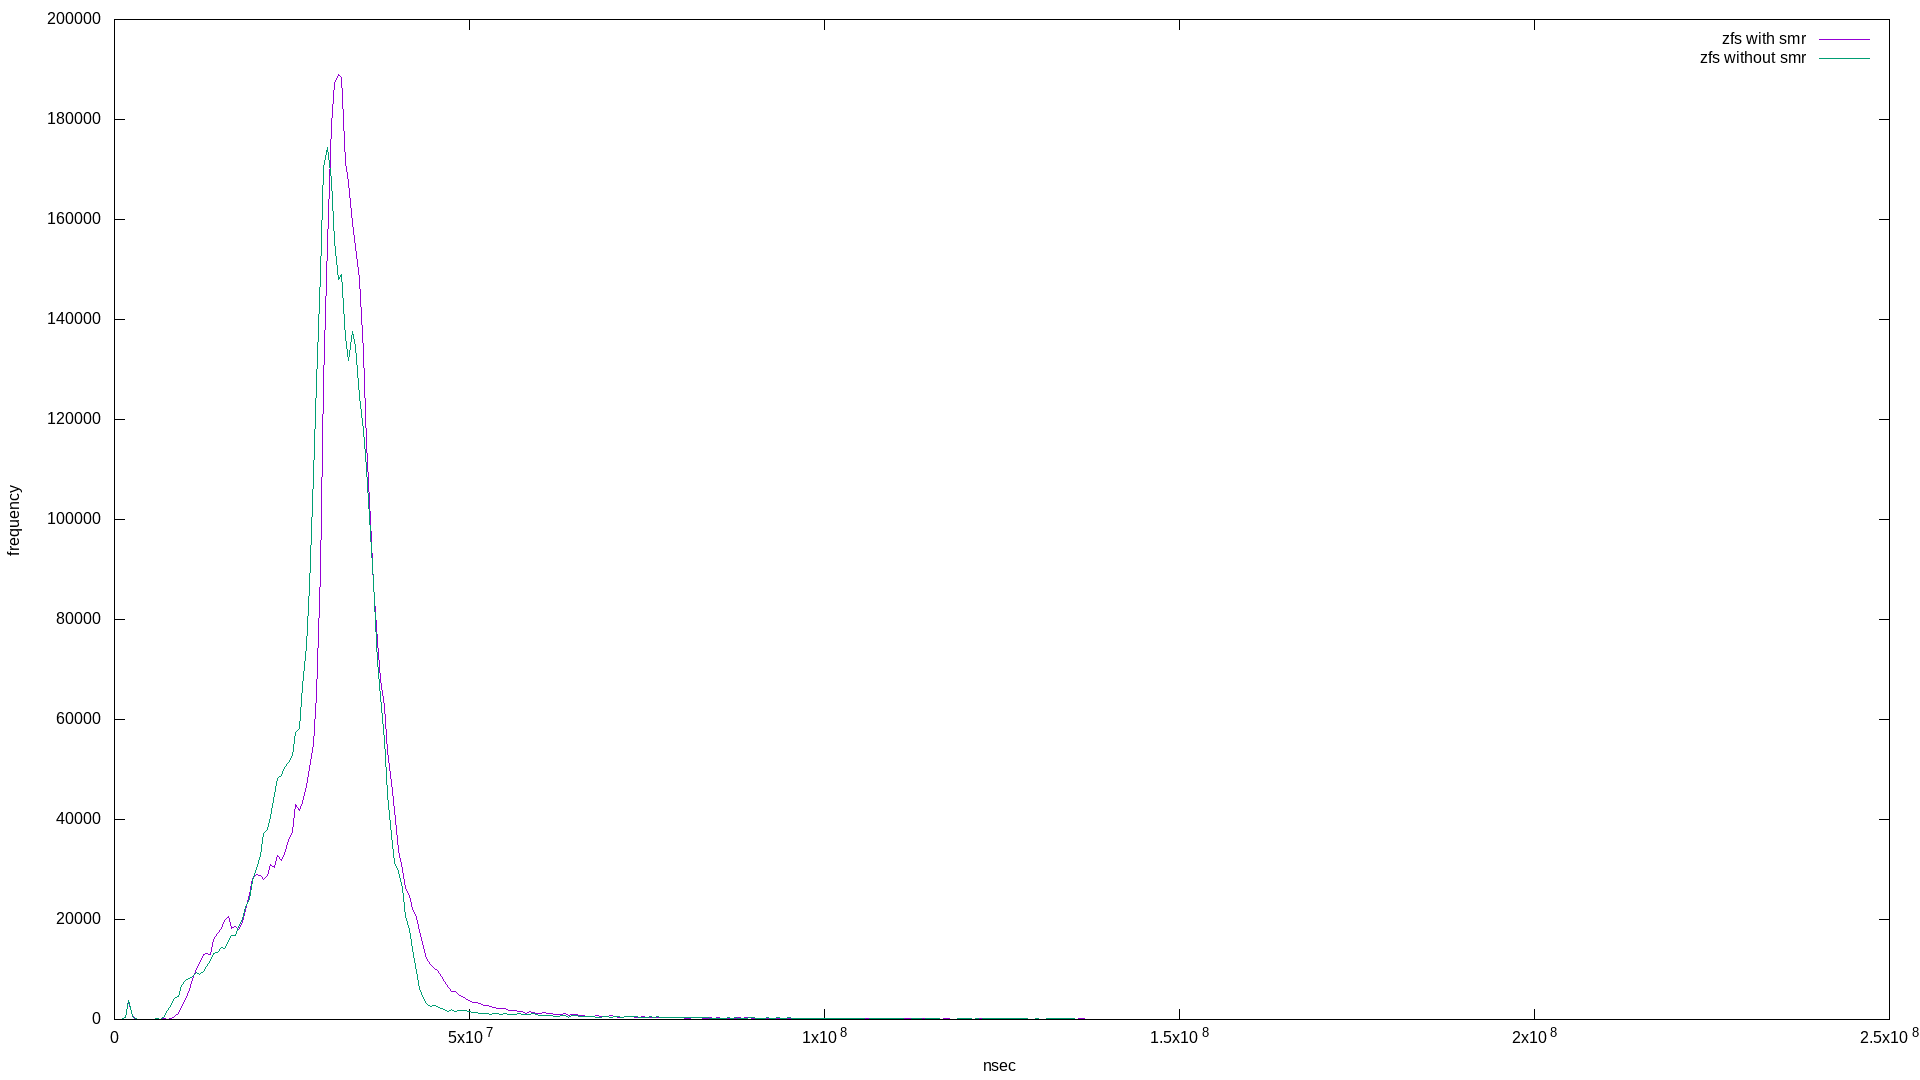
What’s interesting is that these are mostly the same. I suspect this is because of ZFS’s copy-on-write property. Note that the zpool using the SMR drive took longer to complete the 500g randwrite workload:
zfs_with_smr: (groupid=0, jobs=1): err= 0: pid=1772: Tue Apr 28 10:51:14 2020
  write: IOPS=993, BW=124MiB/s (130MB/s)(500GiB/4123913msec); 0 zone resets

zfs_without_smr: (groupid=0, jobs=1): err= 0: pid=21608: Tue Apr 28 11:57:31 2020
  write: IOPS=1031, BW=129MiB/s (135MB/s)(500GiB/3971301msec); 0 zone resets
The difference is 152612 msec, or about 2.5 minutes. This can be seen in the graph because the green points end early on the X axis.
Maybe the above can be explained by the fact that ZFS is a copy-on-write filesystem. zvols (zfs volumes) use blocks from the zpool to emulate a a real disk - maybe zvols are susceptible to the effects of SMR and will show up in the benchmark?
Here is the fio job description:
[global]
rw=randwrite
bs=128k
size=50g
ioengine=libaio
iodepth=32
write_bw_log
write_lat_log

[zvol_with_smr]
filename=/dev/zvol/testpost/fakedisk
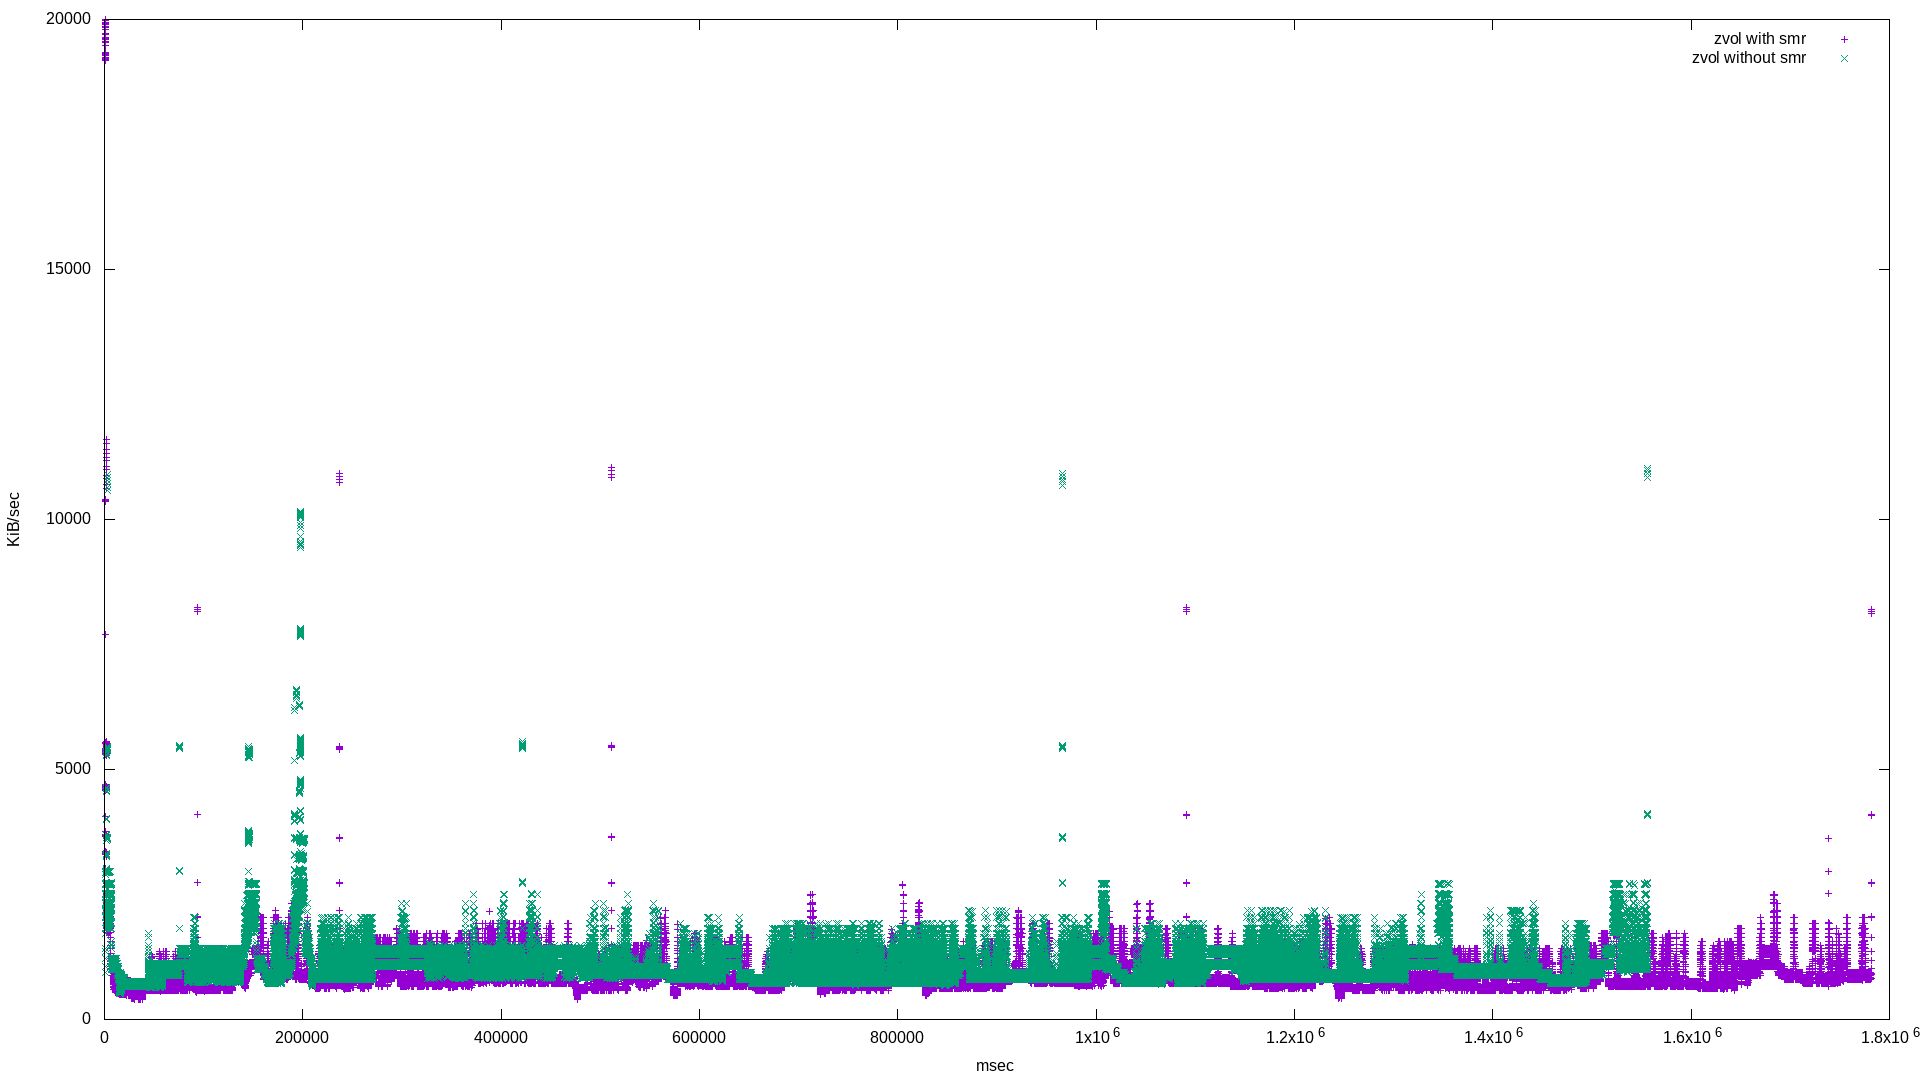
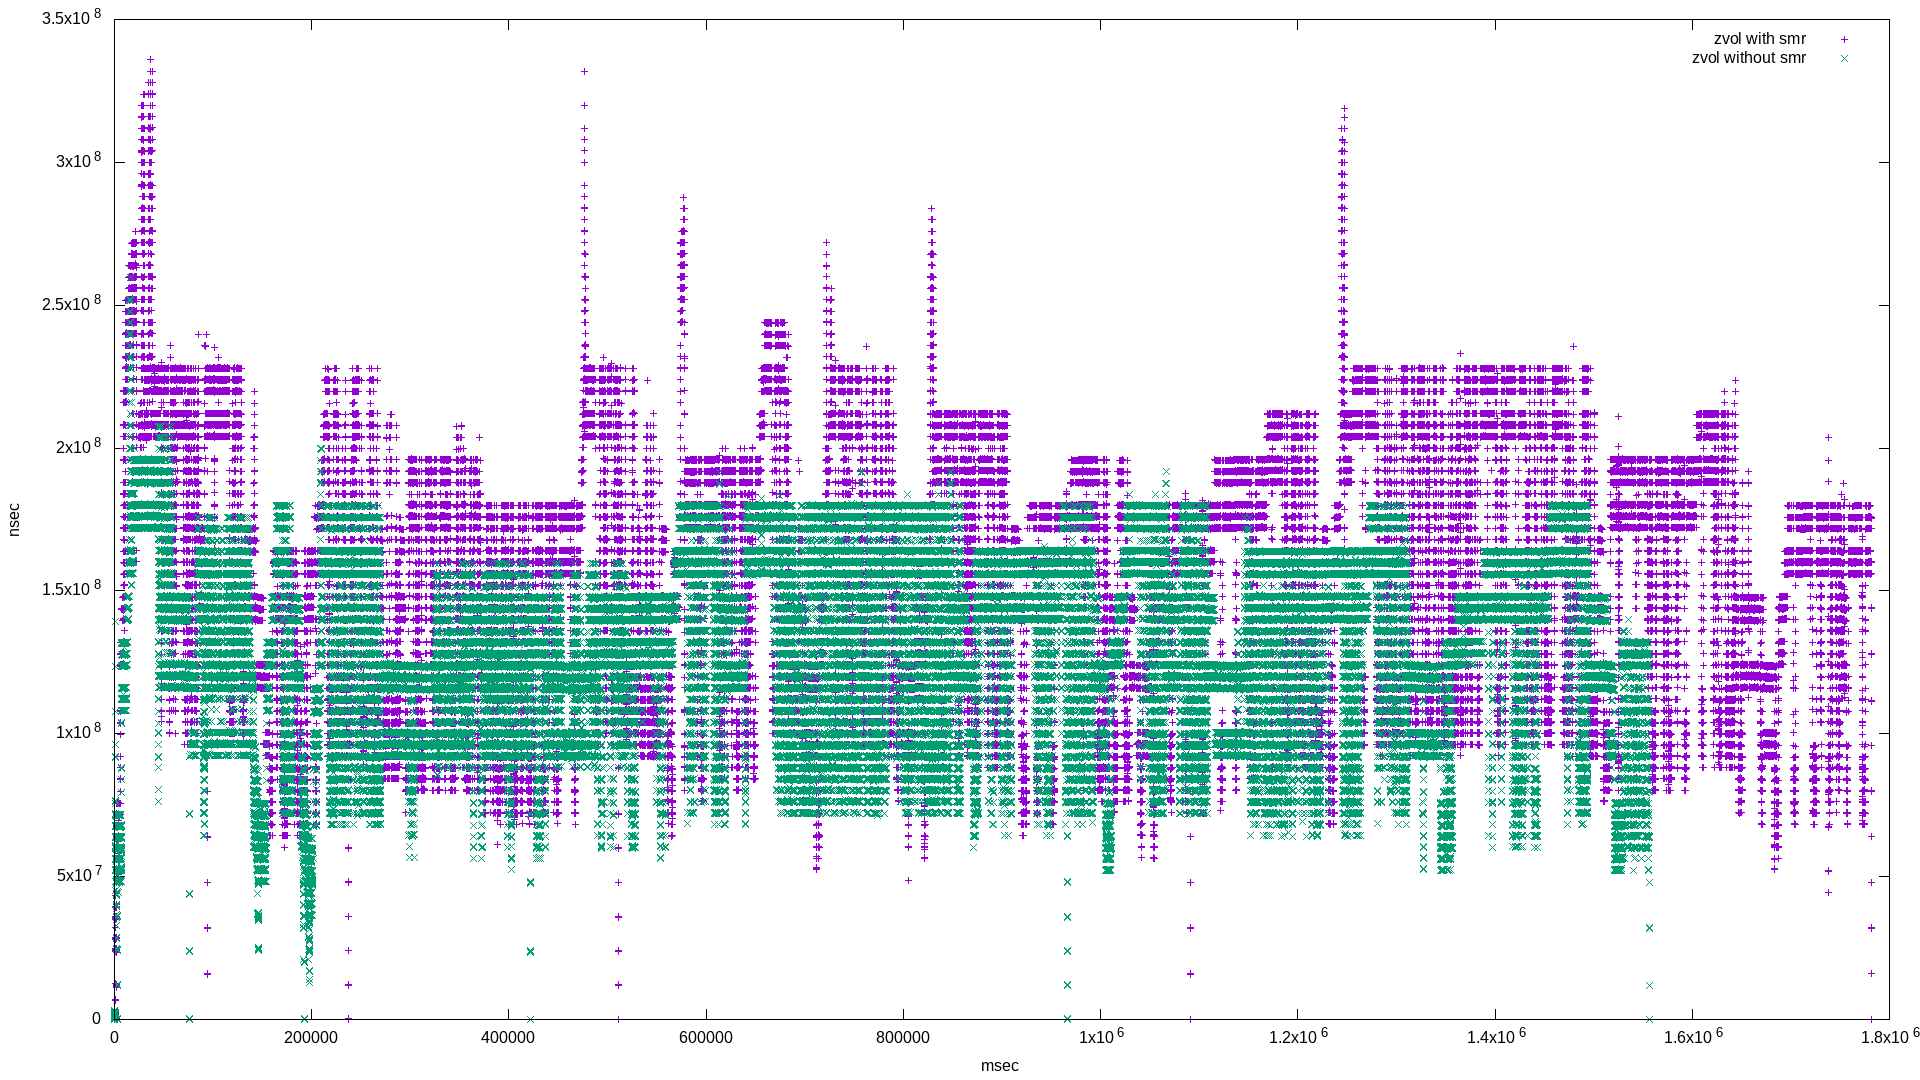
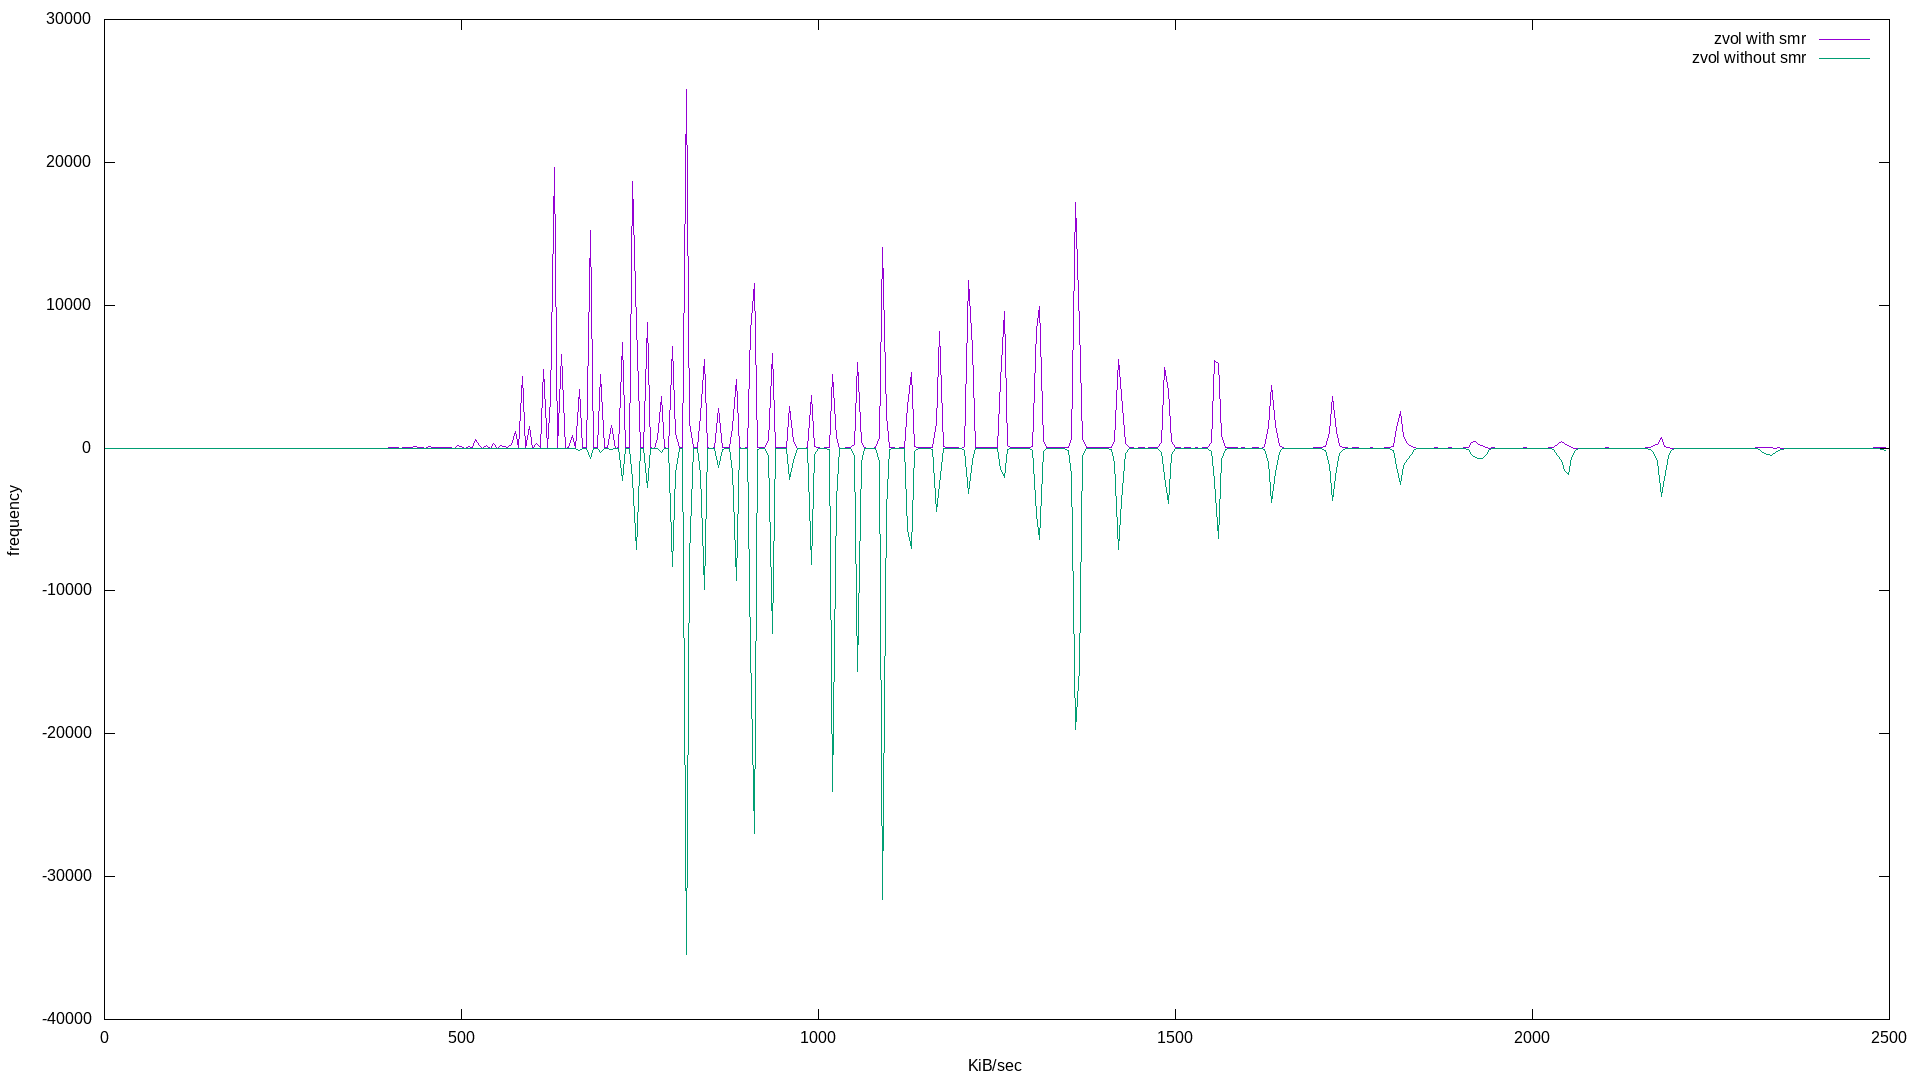
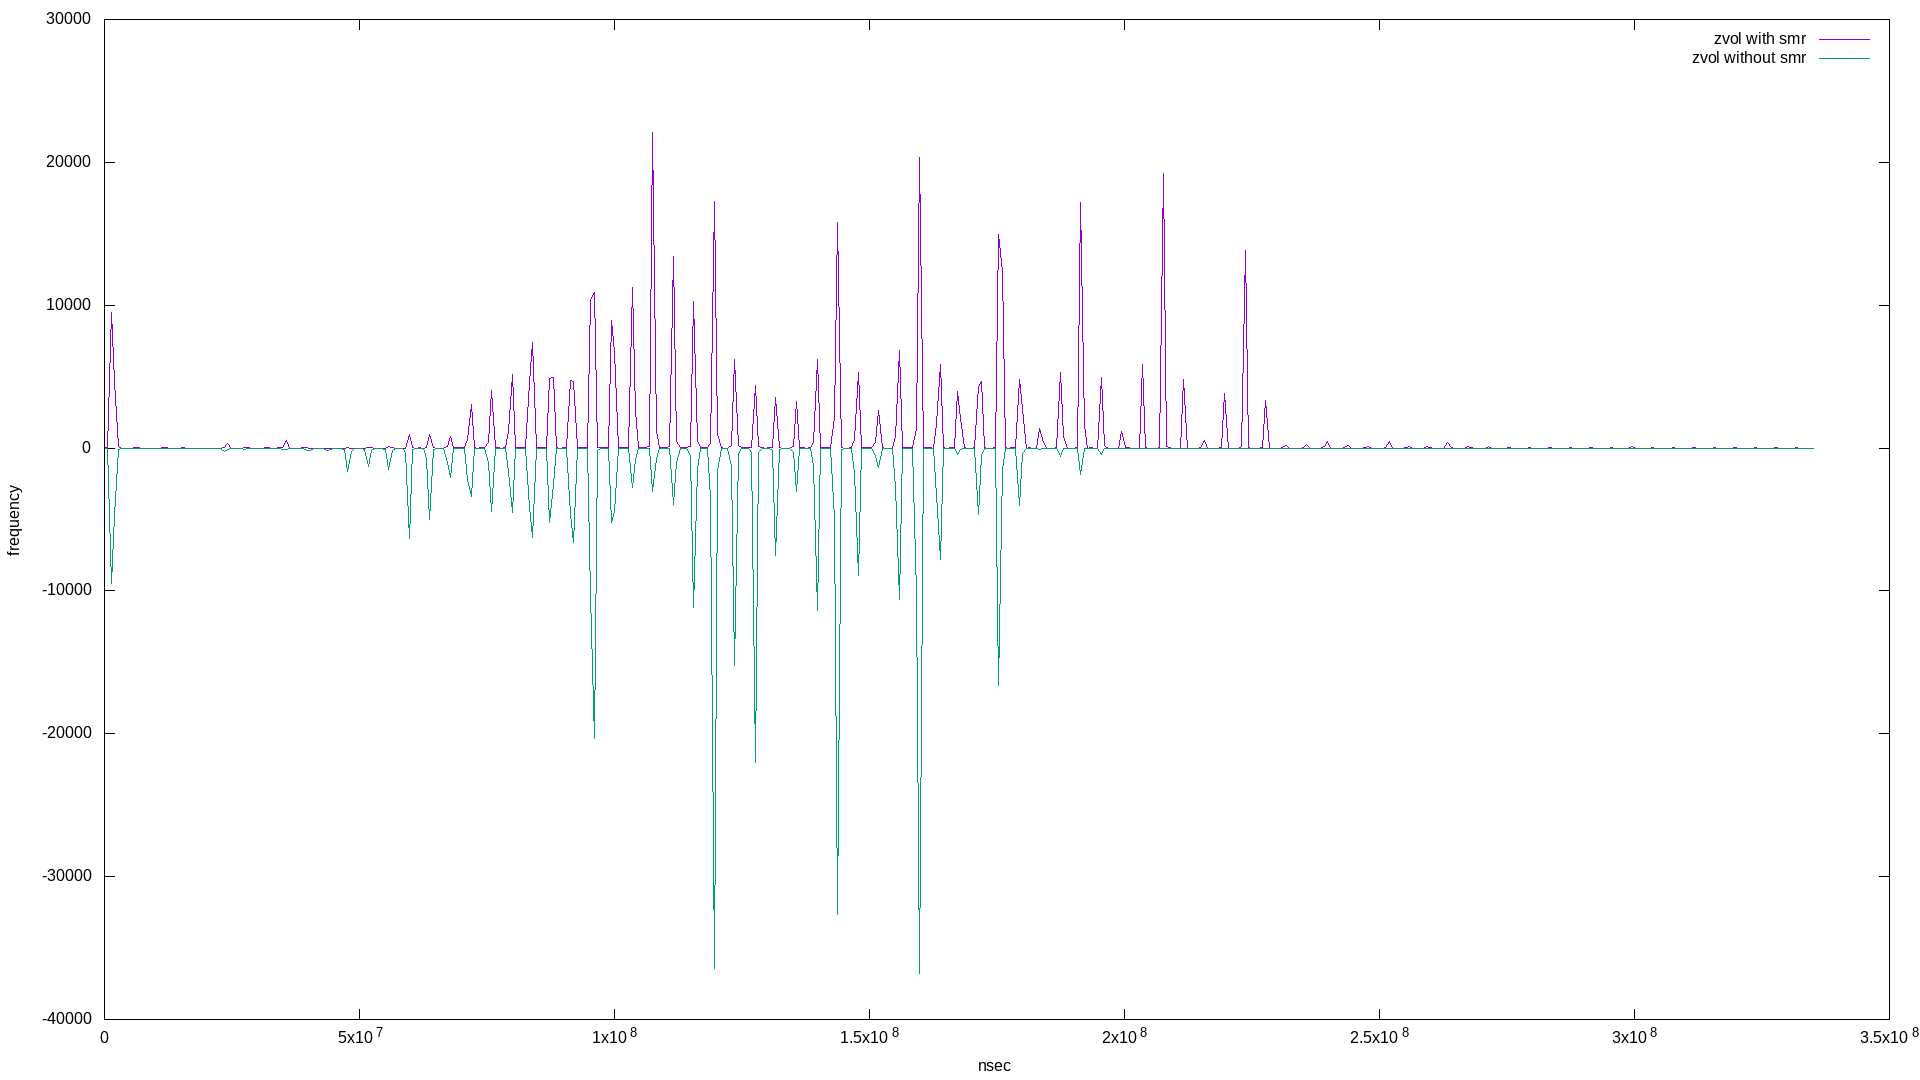
and the results (note I mirrored the histograms for easier comparison):
|
|
|
|
What’s super interesting here is the quantization of both bandwidth and latency! Apart from that, it appears the zvol based on the pool with the SMR disk exhibits more bandwidth frequency at lower values, and more latency frequency at higher values - both negative results.
Here are the fio report summaries:
zvol_with_smr: (groupid=0, jobs=1): err= 0: pid=22449: Tue Apr 28 17:48:11 2020
  write: IOPS=229, BW=28.7MiB/s (30.1MB/s)(50.0GiB/1781561msec); 0 zone resets

zvol_without_smr: (groupid=0, jobs=1): err= 0: pid=31123: Tue Apr 28 18:14:52 2020
  write: IOPS=263, BW=32.9MiB/s (34.5MB/s)(50.0GiB/1556204msec); 0 zone resets
Again, a small difference of only about 3.75 minutes.
After seeing the differences in the zvol benchmark results, I was curious: what if the pool was small? Even if ZFS uses copy-on-write, having a small pool would place pressure on that property.
I created small pools by partitioning the large 8TB disks into one 50G partition. Then, created the same zpools (plus a suffix) using the same disks.
Here is the fio job description:
[global]
rw=randwrite
bs=128k
size=48g
ioengine=libaio
iodepth=32
write_bw_log
write_lat_log

[small_zfs_with_smr]
filename=/testpost_sm/bigfile
And the results:
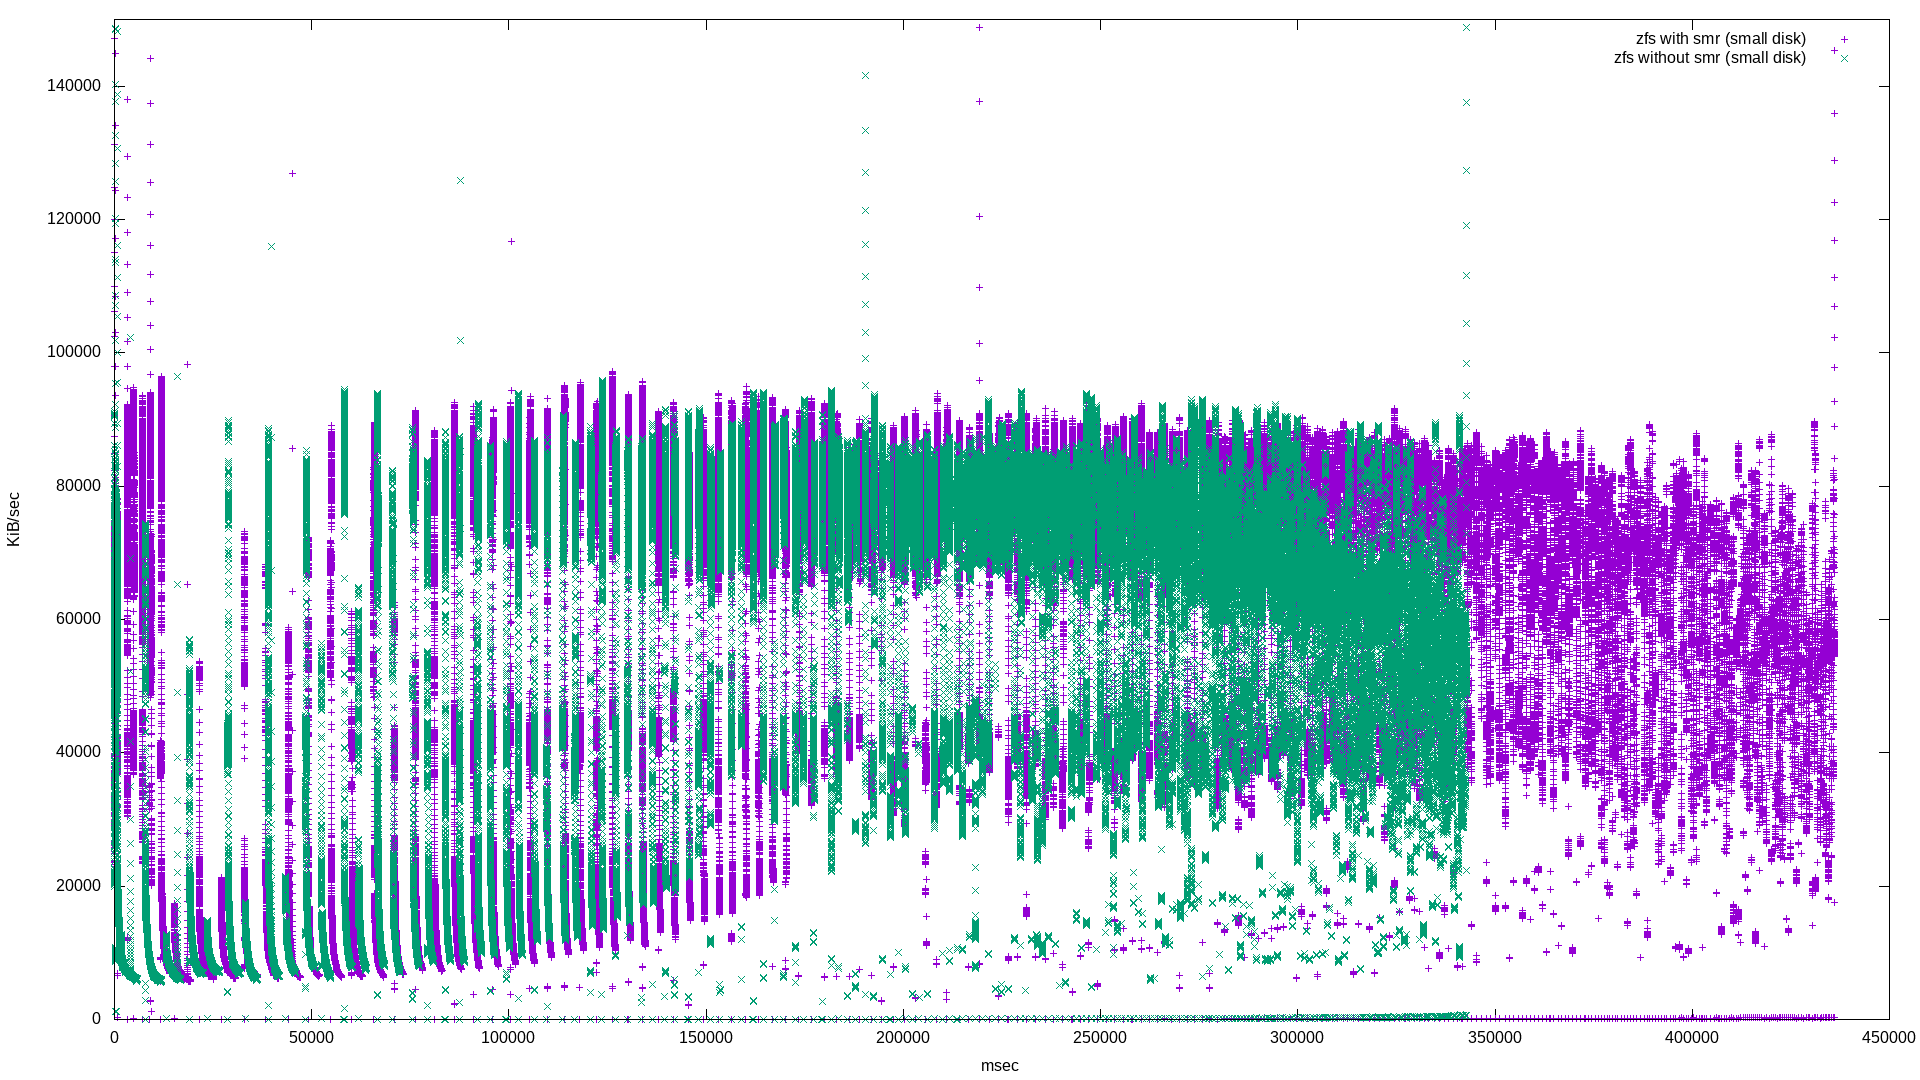
|
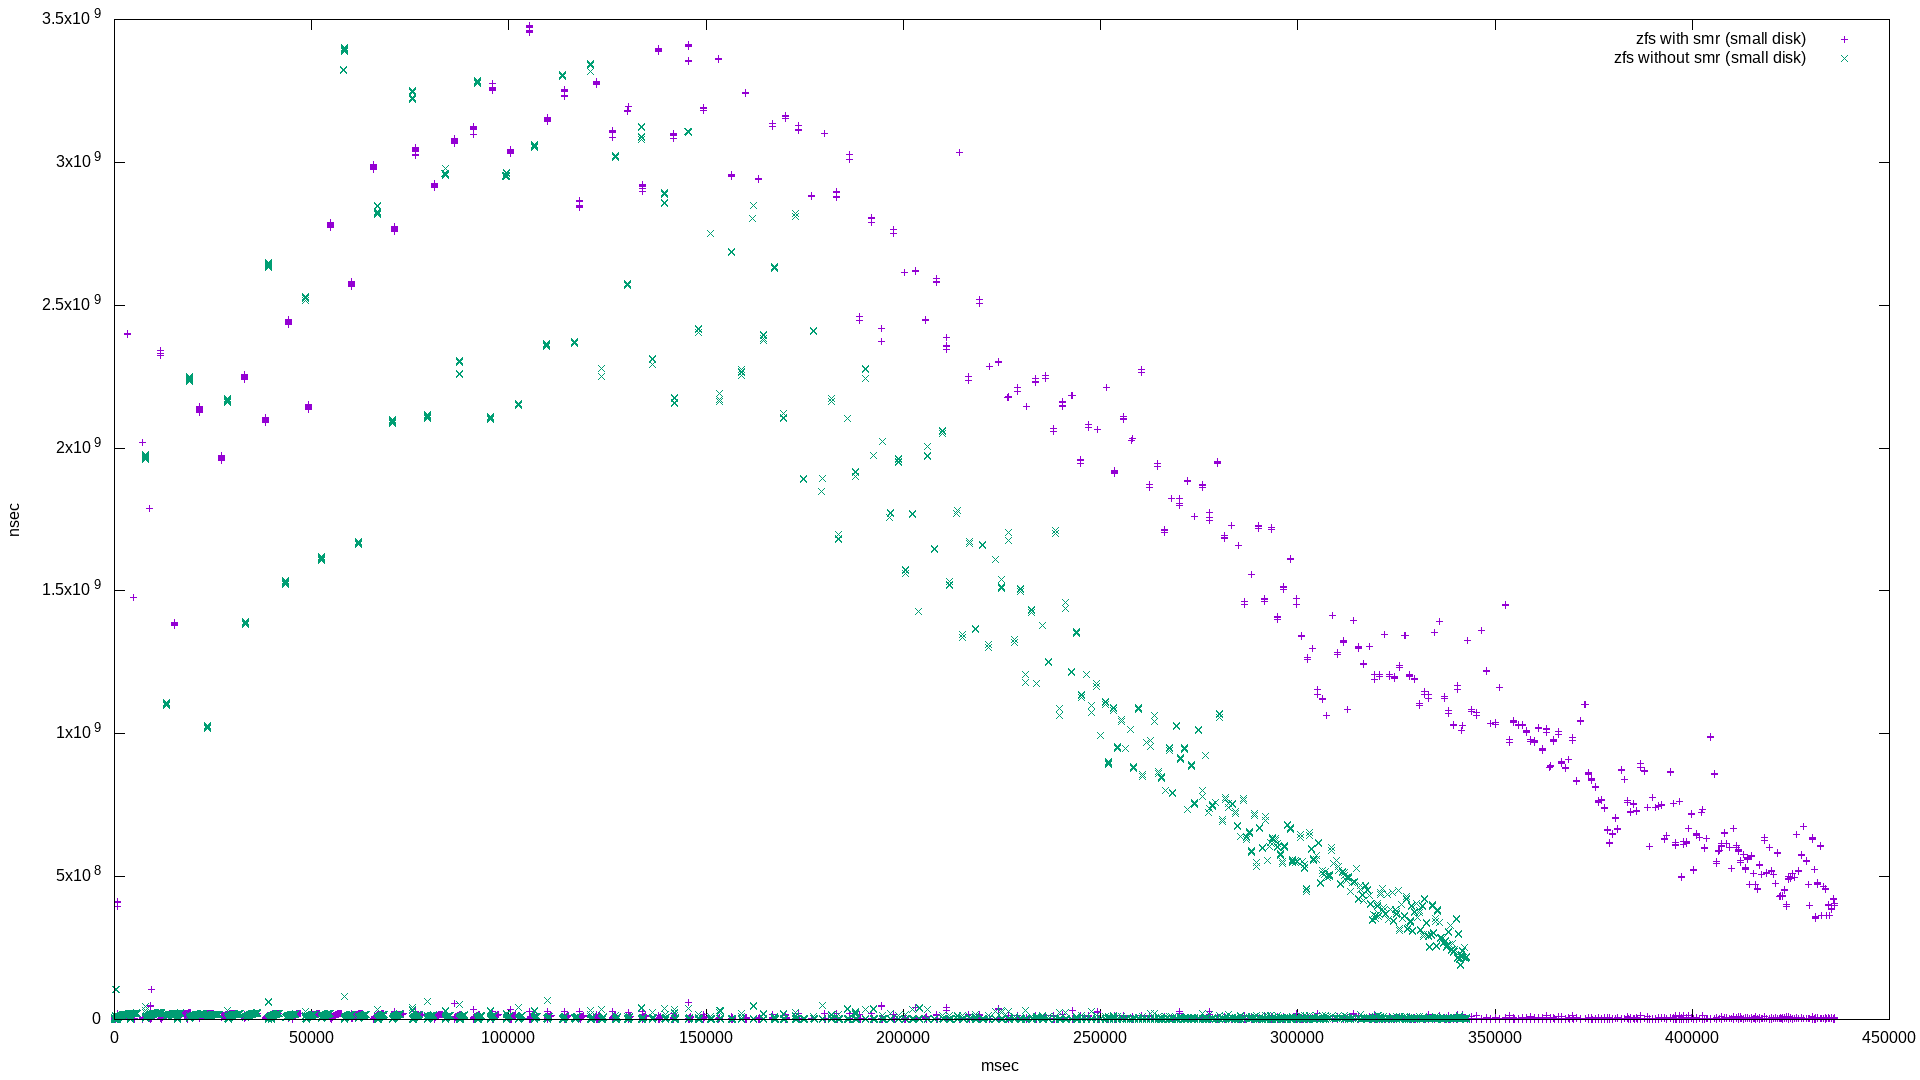
|
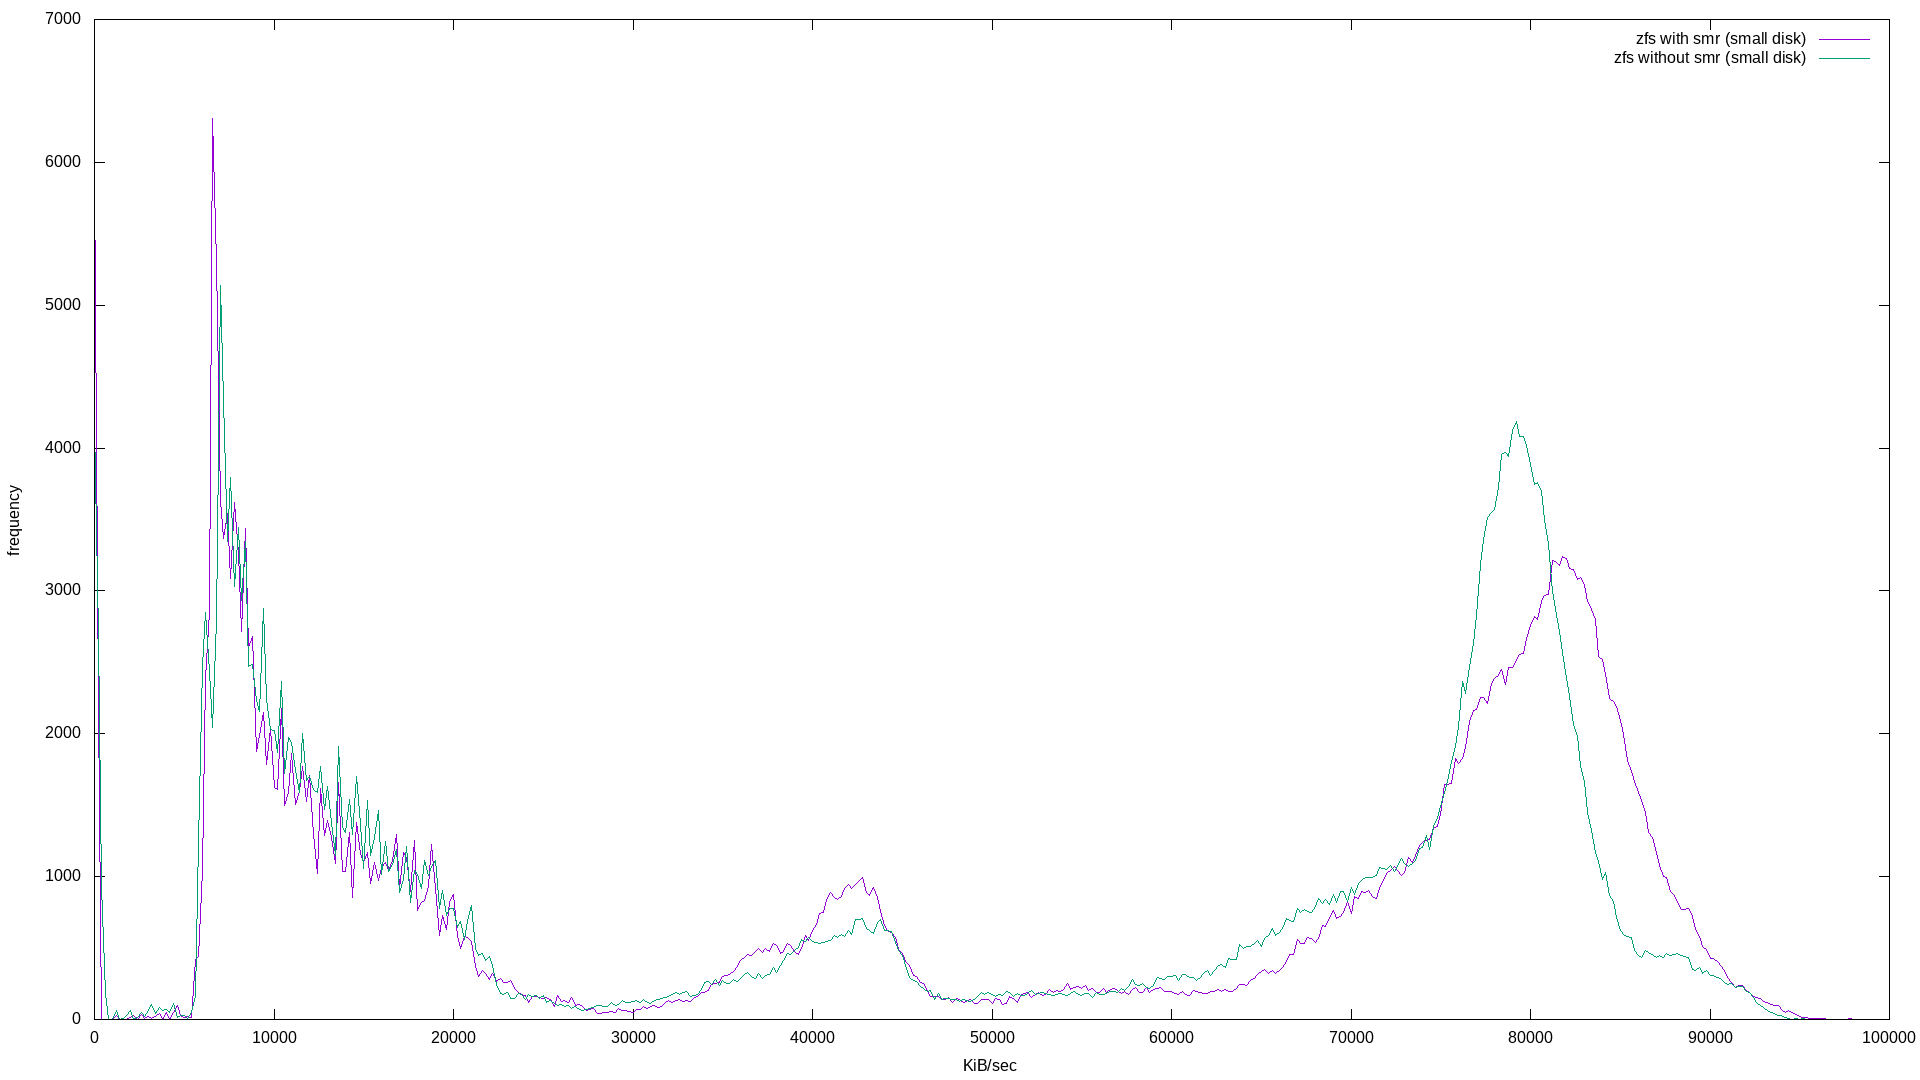
|
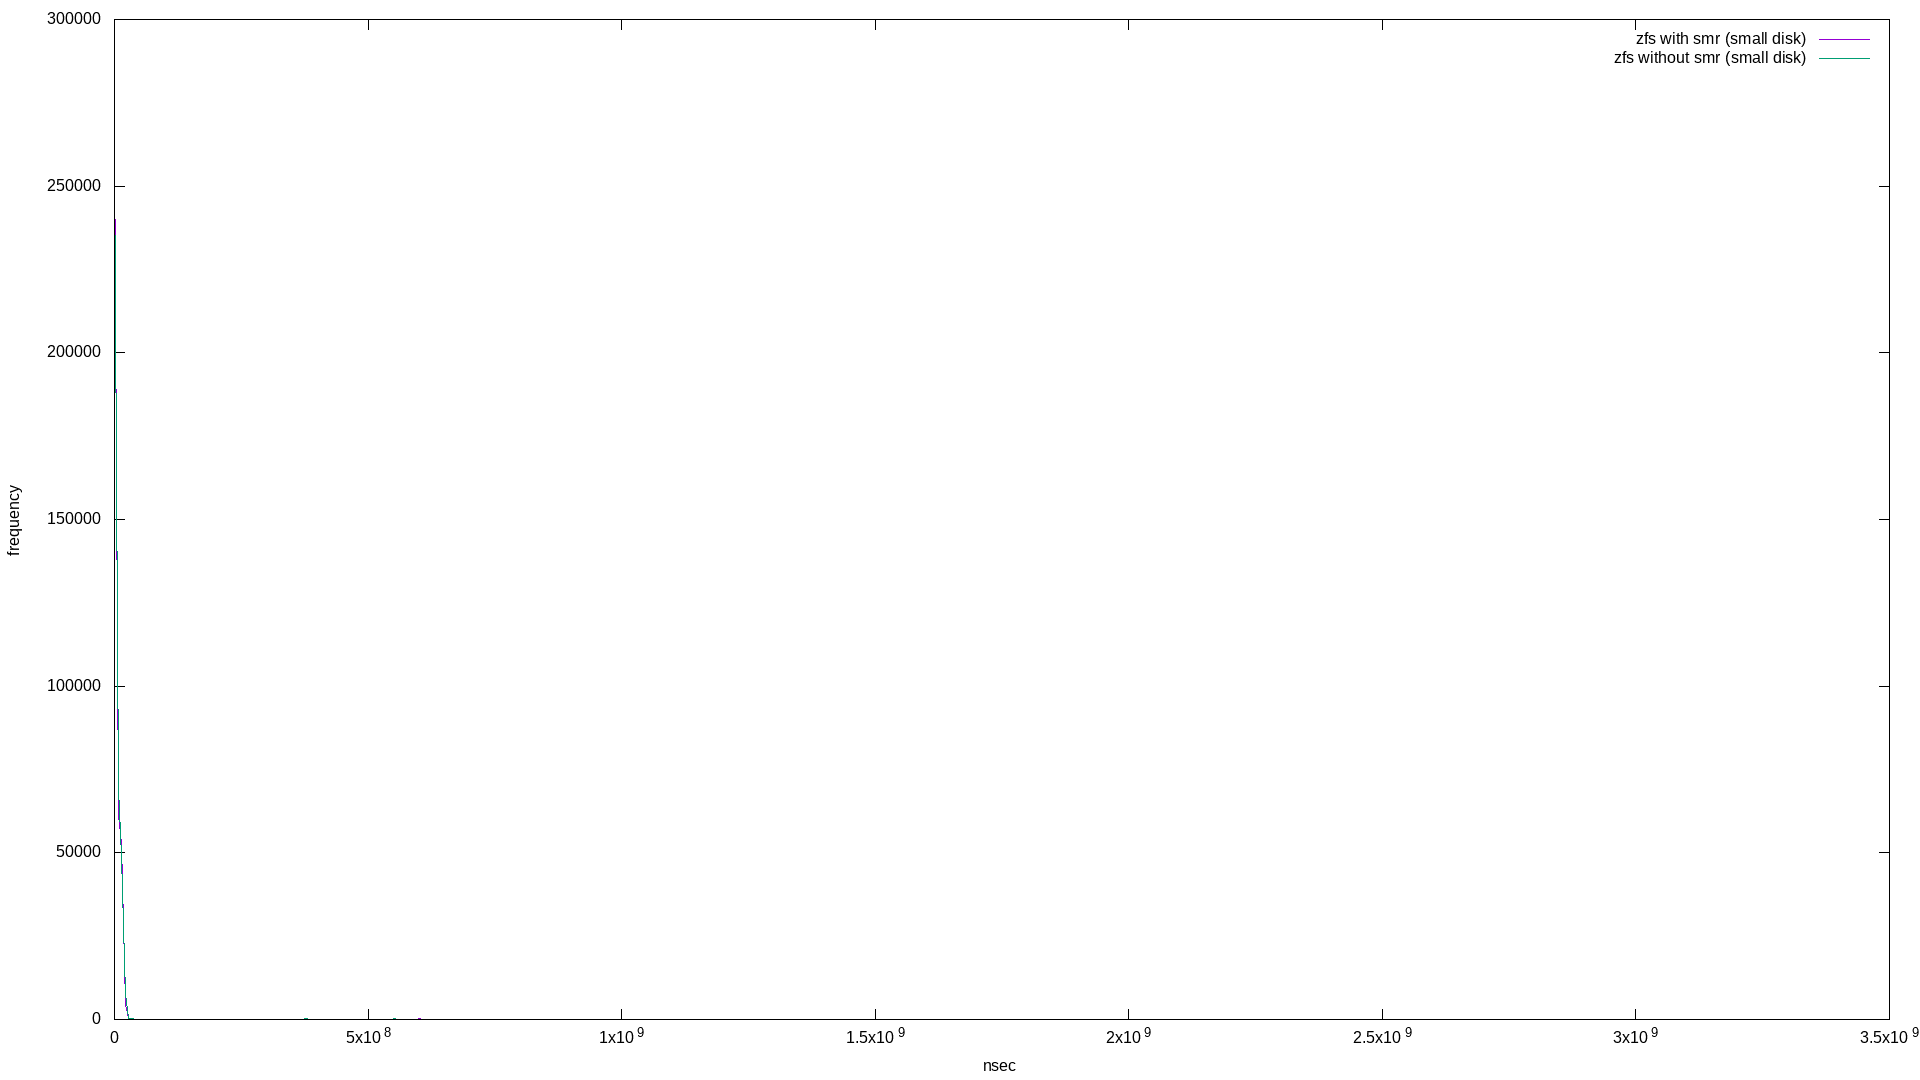
|
The latency histogram isn’t very interesting on this one, but the non-histogram is. It’s very different from the “ZFS file randwrite workload - latency” graph above. It’s probably safe to say that zpools that are nearly full are going to experience a long tail of what looks like 50% higher latency if there are SMR disks in the mix.
Here are the fio report summaries:
small_zfs_with_smr: (groupid=0, jobs=1): err= 0: pid=19454: Tue Apr 28 21:17:32 2020
  write: IOPS=901, BW=113MiB/s (118MB/s)(48.0GiB/436143msec); 0 zone resets

small_zfs_without_smr: (groupid=0, jobs=1): err= 0: pid=23361: Tue Apr 28 21:23:16 2020
  write: IOPS=1147, BW=143MiB/s (150MB/s)(48.0GiB/342809msec); 0 zone resets
Or, about 1.5 minutes difference in completion time. Note there’s a 30 MiB/s difference compared to the non-small ZFS file benchmark difference of 5 MiB/s
It is possible to detect SMR disks using a random write workload of 128k blocks for about 50G. Both raw IO bandwidth and latency are significantly different from conventional drives.
Using one SMR disk and one conventional disk in a zpool mirror set up will show a slight performance hit if the pool is empty, and a larger performance hit (plus a long tail of about 50% increased latency) if the zpool is close to full.